Airtran (AAI) Stock Profile
Some reasons why Airtran (AAI) has done so
well this year is based on Sales and Earnings Growth along with being in a
strong performing Industry Group.
The chart below shows how Airtran's Sales and Earnings Growth really
increased substantially from 2002 into 2003 as compared to 2001 into the early
part of 2002.
In addition note the change in the Relative Group Strength of the Airline
sector over the past year as well in which the Group Strength has increased from
7 a year ago to 97 this month. Also note the Airline stocks have
been up 66% as a group during the past year.
| INDUSTRY |
CURRENT |
1
Month |
3
Months |
6
Months |
1
Year |
One
Week |
Total
Return |
| GROUP |
RANK |
Ago |
Ago |
Ago |
Ago |
Change |
since 1/1/03 |
| Transportation-Airlines |
97 |
98 |
79 |
19 |
7 |
8.9% |
66.0% |
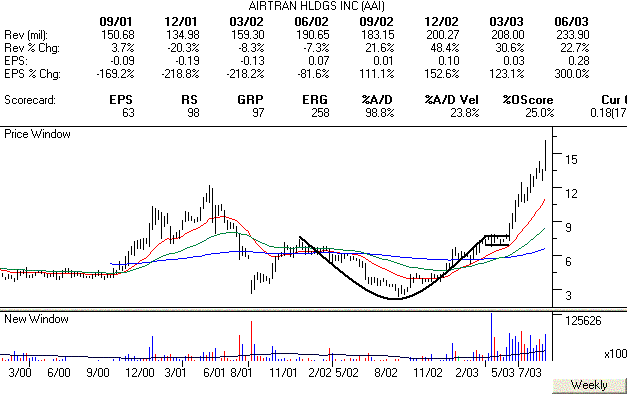
Meanwhile Airtran (AAI) has
been one of the leaders in the Airline sector as has done very well stock price
wise over the past year. As you can see below AAI broke out of a
favorable Cup and Handle (H) pattern in May of 2003 accompanied by strong volume
and has nearly doubled in price since through August of 2003.
Remember when looking for stocks to invest in focus on
those with the following:
1. Increasing Sales and Earnings Growth
2. Reside in a strong performing Industry Group
3. Are exhibiting a favorable chart pattern such as the "Cup and
Handle" before breaking out.
Signup Today for a
"Free" 2 Week Premium Trial Membership to amateur-investor.net
and see which Stocks are setting up to make Significant Gains in the weeks
ahead
|

