|
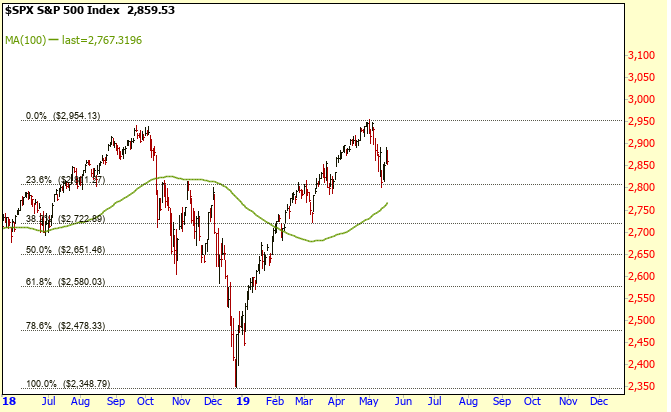
The S&P 500 held support early in the week near the 23.6% Retrace which was just
above the 2810 level. Thus was then followed by a decent oversold bounce.
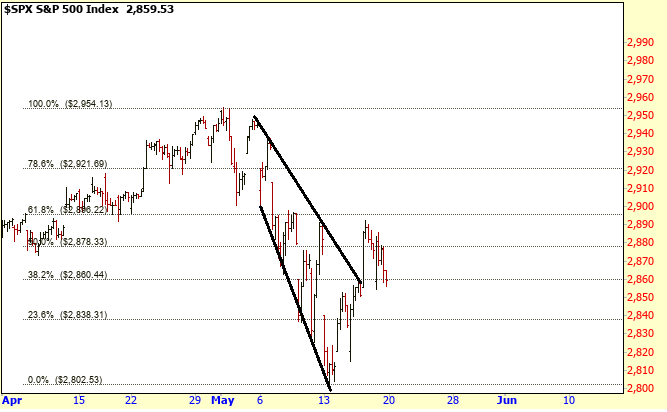
An intra day chart shows the S&P 500 almost rallied back to the 61.8% Retrace
(calculated from the 2800 low), after breaking above its downward channel.
One thing to watch for next week is a potential Head and Shoulders pattern with
Neckline support at the 2800 level. For this pattern to play out the S&P
500 would have to test the Neckline early in the week. If the Neckline
were to be taken out then the next support level is in the 2767 to 2722 range.
2767 is at the 100 Day MA (green line) while 2722 is at the 38.2% Retrace.
Finally, the last thing I would like to point out, is a longer term chart of
Mutual Fund Cash adjusted for Interest Rates. As you can see below, when
the Cash levels have dropped below 1% (points A) typically market tops have
followed.
Amateur Investors
|

