|
(10/15/16)
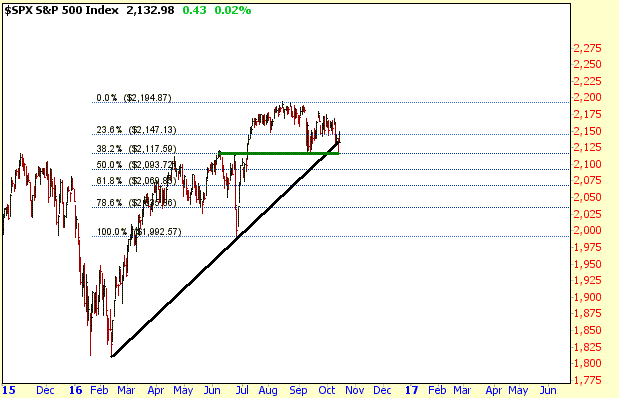
The S&P 500 appears to be at a key inflection point as it
briefly dropped below its upward trend line from the February low. So far
it has found support just below the trend line which was at the 38.2% Retrace
from the late June low to the August high (green line). 
Meanwhile
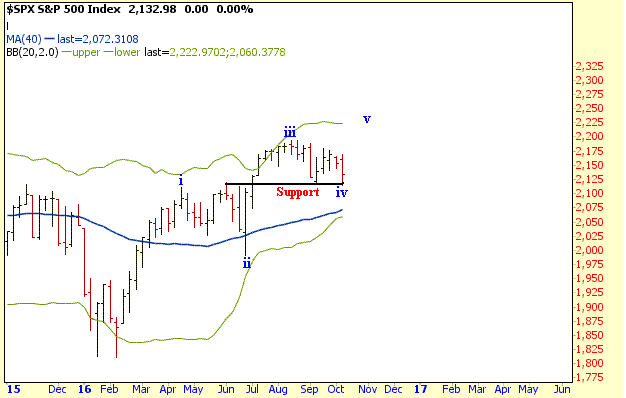
if a 5 Wave affair is occurring from the February low last week's low of 2115
must hold next week. If the 2115 level is broken then a drop back to the
2070 area is possible which is along the 40 Week Moving Average (blue line) and
lower Bollinger Band. 
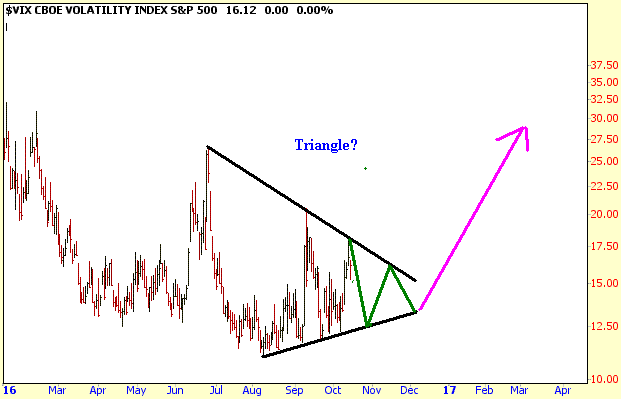
Finally the VIX
appears to be developing a Triangle pattern as long as it doesn't rise
significantly above last weeks high at the 18 level. Keep in mind Triangle
patterns can be complex and last longer than expected so it could take another 6
to 8 weeks to complete. Once the Triangle pattern completes then a
sharp upward move would follow as we move into 2017. Since the VIX
and S&P 500 usually move in opposite directions if a sharp upward move were
to occur in the early part of 2017 that would signal a decent correction in the
S&P 500. 
Amateur Investors
|


