|
Is the S&P 500 completing the Final Wave of and Elliot
5 Wave Pattern?
For those that
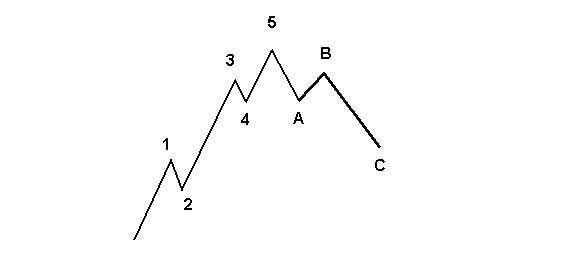
don't know about Elliot Wave Theory sometimes the market will go through a
series of waves with three upward moves (Waves #1, #3 and #5) and two downward
moves (Waves #2 and #4) while completing a "5" Wave Pattern. Once the
5 Wave Pattern is completed this is then followed by a longer term "ABC"
correction as shown by the chart below. 
If
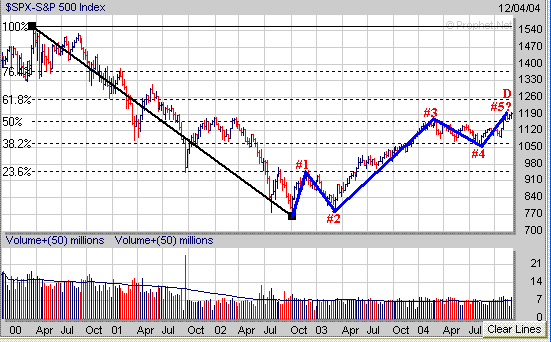
we look at a longer term chart of the S&P 500 it bottomed in October of 2002 and its 1st upward wave (#1)
stalled out at its longer term 23.6% Extension Level calculated from the 2000
high to the October 2002 low near 950. The S&P 500 then went through a
corrective wave (#2) before going through an extended upward wave (#3) which
stalled out near its 50% Extension Level around 1160. This was then followed by
another corrective wave (#4) in which the S&P 500 found support at its 38.2%
Extension Level near 1060. Meanwhile since mid August the S&P 500 appears to be
exhibiting the final upward wave (#5) which will eventually complete an Elliot 5 Wave
Pattern sometime in early 2005. It does appear the S&P 500 will have a
chance to rally up to its longer term 61.8% Extension Level near 1255 (point D)
before the 5th Wave is completed (point A)
which will likely act as a significant area of upside resistance. Once
the 5 Wave pattern is completed there is a strong possibility the S&P 500
will then go through an extended correction (ABC move) as shown by the previous
chart and retrace from 23.6% to 38.2% of its longer term move that began in
October of 2002. 
Signup today for a 2
Week Trial Membership and have access to our Stocks
to Watch List which provides a list of Stocks that are exhibiting a favorable Chart
Pattern such as the "Cup and Handle". Also you will receive our Daily Breakout Report
by email which Alerts you to Stocks
that are breaking out of a favorable Chart Pattern from our Stocks
to Watch List.
Click
Here to signup for a "Free" 2 Week Trial Membership
Amateur-Investor.net
|


