|
What is the Bullish-Bearish Indicator Signaling?
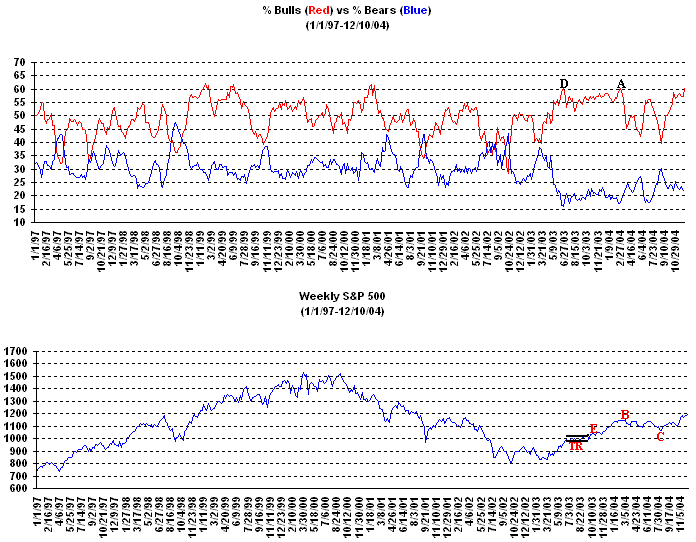
The % of Bullish Investment Advisors as tracked by Investors
Intelligence has recently risen above the 60% level. The last time the %
of Bullish Investment Advisors rose to 60% was in March (point A) which signaled
a top in the S&P 500 and was followed by a correction that lasted until mid
August (points B to C). Going back even further shows that the % of
Bullish Investment Advisors also rose to 60% in June of 2003 as well (point
D). However in this case the S&P 500 basically traded sideways (TR)
from July of 2003 through September of 2003 before rallying strongly from
October of 2003 through early March of 2004 (points E to B). 
With such a large amount of Bullishiness in the market it
appears two scenarios could develop in the weeks ahead. First we could
eventually see some type of correction develop lasting several weeks like
occurred in the S&P 500 from March to August of this year. Meanwhile a
second scenario we could eventually see develop would be for the S&P 500 to
trade sideways for several weeks like occurred from June of 2003 through
September of 2003. At this point it's still not clear which scenario may
evolve in the weeks ahead.
Signup today for a 2
Week Trial Membership and have access to our Stocks
to Watch List which provides a list of Stocks that are exhibiting a favorable Chart
Pattern such as the "Cup and Handle". Also you will receive our Daily Breakout Report
by email which Alerts you to Stocks
that are breaking out of a favorable Chart Pattern from our Stocks
to Watch List.
Click
Here to signup for a "Free" 2 Week Trial Membership
Amateur-Investor.net
|


