Double Top
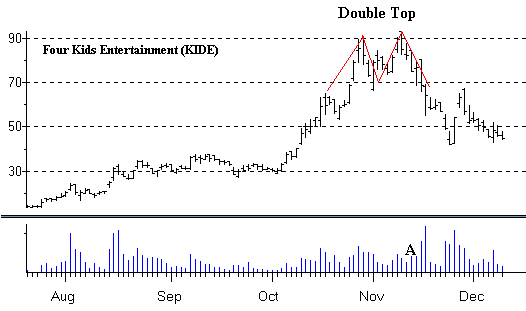
The Double Top pattern is the reverse of a Double Bottom and looks like an upside down "W" or "M" shape. If the second top is being made on lower volume watch out as this maybe a sign a big sell-off is coming. Some examples are shown below.

After KIDE made its first top around $90 in late October it pulled back to around $70 by early November. It then rose back to $90 by mid-November and made a second top (Double Top) on lower volume (point A) before selling off on increasing volume. As you can see KIDE went from $90 to $40 in less than three weeks. If you had a position in this stock and didn't get out at the first top then you would have had a second opportunity to sell at the second top. Hopefully as an investor you will recognize this pattern and not buy a stock making a second top especially if its on lower volume.

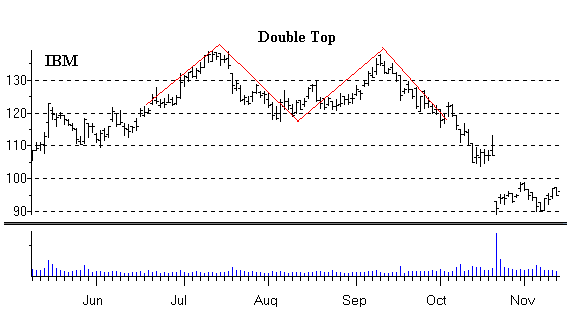
Even the big stocks will show similar patterns as this chart of IBM shows. IBM made the first top in mid-July and then pulled back to around $120. It then rallied back up to its previous high of $140 in mid-September (Double Top) but couldn't sustain its momentum and sold-off sharply the next several weeks ($140 to $90). Although it's hard to see, the second top made by IBM in mid-September was on lower volume.
Another chart pattern that exhibits a sell signal is the Head and Shoulders Top. Click on the link below to see some examples of this pattern.