Exchange Traded Funds (ETF's)
If
you like to trade the Exchange Traded Funds such as the DIA's, QQQQ's or SPY's
our ETF Weekly Signals generated from our Market Timing Indicator (MTI) will
help you determine when to go Long or Short in the major ETF's on a Weekly
basis. Basically we are looking to take advantage of Oversold or
Overbought Conditions in the ETF's and to either go Long or Short in them.
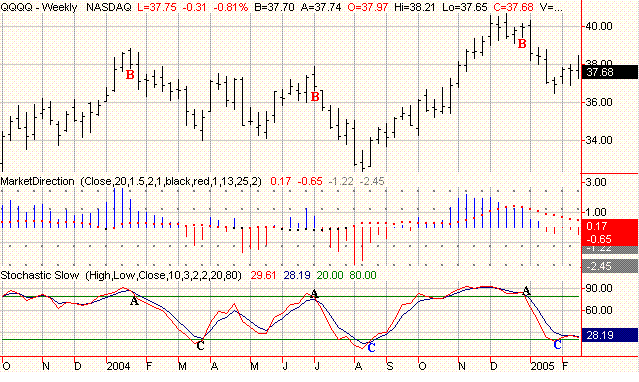
The chart below is a Weekly Chart of the QQQQ's from 2004 into early 2005.
Our strongest Overbought Signals occur when
the %K Line (red line) in association with the Slow Stochastics rises above 80
and then drops back below 80 and its %D Line (blue line). In 2004 there
were three strong signals generated to go Short (points A). A Short Signal
is generated when we get a strong downside reversal bar and the price drops
below the previous weeks low (points B). Meanwhile
the Short position is then covered once the %K Line (red line) either drops
below 20 (points C) or rises back above the %D Line (blue line). 
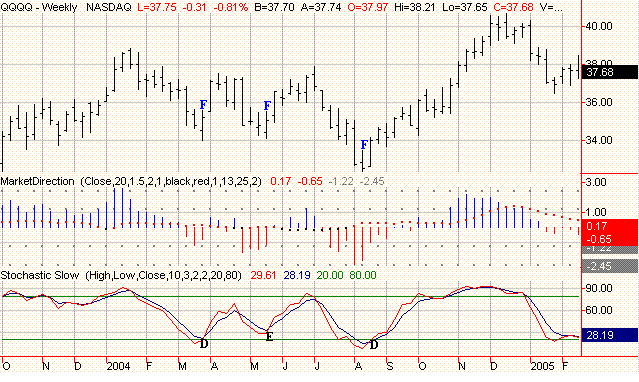
Meanwhile when the market has become
Oversold we then look for a Long (Buy) Signal on a Weekly basis once the %K Line
(red line) has dropped below 20 and then rises back above it and its %D Line
(blue line). In 2004 we had two strong Oversold Signals on a Weekly basis
(points D) with a third not as strong signal in May (points E). The Buy
Signal was confirmed once the price rose above the previous weeks high (points
F). Meanwhile profits are taken once the %K Line (red line) rises
above 80 and then drops back below 80 or drops below the %D Line (blue line).

A comparison summary of the ETF Weekly Signal Performance going back to 1999 is
shown below versus the averages that they track. On average generally 6 to
8 signals a year are generated by our Weekly ETF Timing Indicator.
As you can see taking advantage of Oversold and Overbought Conditions in the
Market can lead to substantial gains especially when the market is not having a
good year like we saw in 2000, 2001 and 2002.
Amateur Investors ETF Weekly Signal Performance (1999-2004)
Average 6 Year Return (DIA: +36.45, QQQQ: +52.6%, SPY: +31.6%)
| ETF |
2004 |
2003 |
2002 |
2001 |
2000 |
1999 |
| DIA
(Dow) |
26.90% |
26.90% |
48.10% |
57.30% |
30.90% |
28.30% |
| QQQQ
(Nasdaq 100) |
37.40% |
29.40% |
59.50% |
56.20% |
81.70% |
51.20% |
| SPY
(S&P 500) |
25.20% |
28.80% |
51.90% |
39.80% |
25.30% |
18.60% |
Major Index Performance 1999-2004
Average 6 Year Return (Dow: +3.9%, Nasdaq 100: +9.0%, S&P 500: +1.4%)
| Index |
2004 |
2003 |
2002 |
2001 |
2000 |
1999 |
| Dow |
3.10% |
25.30% |
-16.70% |
-7.10% |
-6.20% |
25.20% |
| Nasdaq
100 |
10.00% |
49.10% |
-37.60% |
-32.60% |
-36.80% |
102% |
| S&P
500 |
9.00% |
26.40% |
-23.30% |
-13.00% |
-10.10% |
19.50% |
Thus using our Weekly Signals on the three major ETF's will substantially
increase your profits on a yearly basis.
Click
Here to Signup for a Free Trial Membership and have access to
our Weekly Signals involving the three major ETF's
|


