History of the Volatility Index (VIX)
The Volatility Index (VIX) began in 1986 so it has been around for 21
years. Currently there are some interesting things occurring in
the VIX which could possibly give us an idea of what could be in store for
the market in the longer term.
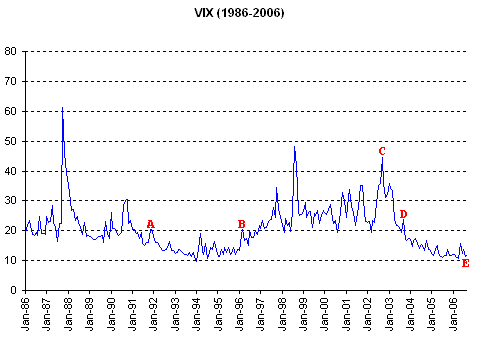
As you can see below the VIX was rather volatile when it first
started out in the mid to late 1980's however beginning in 1992 the amount of
volatility began to decrease as the VIX bascially stayed below a value of 20
through 1996 (points A to B). However starting in 1997 the volatility
began to increase once again and continued through 2003 (points B to C)
before beginning to diminish once again from 2004 through 2006 (points D to E).

Next if we take a look at what happened to the S&P 500 from
1992 through 1996 it looks rather similar to what has occurred from 2003 through
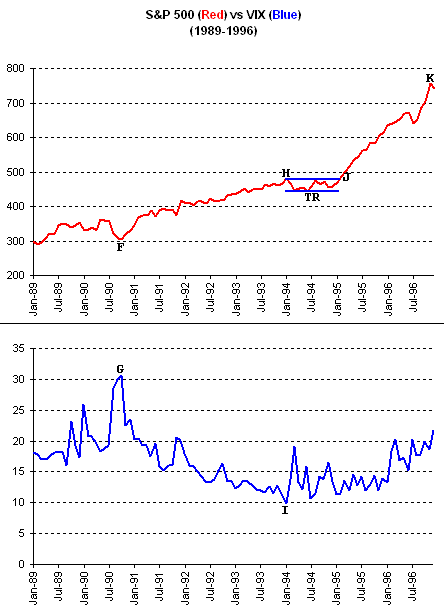
2006. The chart below takes a look at the S&P 500 versus the VIX from
1989 through 1996.
Notice that the S&P 500 made a bottom in mid 1990 (point F) as
the VIX spiked above the 30 level (point G). This was then
followed by a sustained rally that lasted from the middle part of 1990 through
1993 (points F to H) in which the S&P 500 gained over 60% as the VIX was
in a steady downtrend (points G to I). Then in the early part of 2004 the
VIX dropped to around a value of 10 and began to develop a trading range
generally between 10 and 15 for most of 1994 through 1995. Meanwhile
also notice the S&P 500 developed a trading range (TR) as well as
it moved nearly sideways in 1994 before eventually moving higher
again starting in 1995 which continued through 1996 (points J to K).

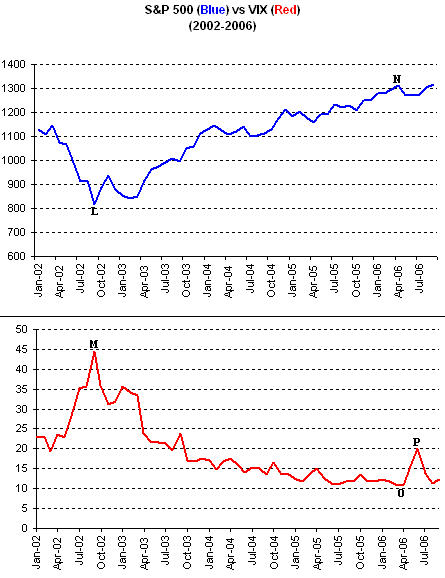
Now let's look at the VIX versus the S&P 500 from 2002
through 2006. Notice in the chart below the S&P 500 made a bottom in
late 2002 (point L) as the VIX spiked up above a value of 40 (point M) much like
occurred in 1990. Meanwhile the S&P 500 has gone through a
sustained rally from late 2002 through 2006 (points L to N) and has gained over
70% as the VIX has been in a steady downtrend since late 2002 (points M to O)
much like we saw from mid 1990 through 2003. Furthermore just
like occurred in the early part of 1994 the VIX briefly spiked up to
around 20 (point P) in June and has recently trended lower again much like we
saw in 1994 as well.

The question at this point is will the S&P 500 now develop
a trading range during the next several months like occurred in
1994 before eventually making another substantial move higher at some
point in the middle to latter part of 2007 like we
saw from 1995 through 1996?
|


