
Click Here to signup for a
"Free" 2 Week Trial Membership
Members have access to our Stocks to Watch List and Daily Breakout Reports
Mid Week Market Analysis
(8/19/03)
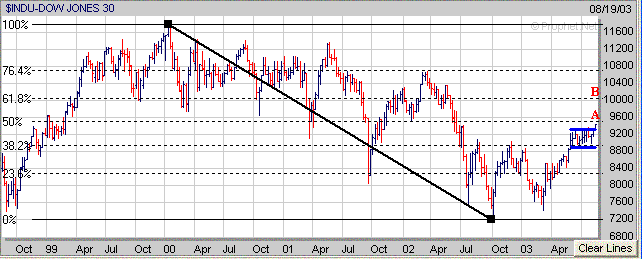
So far the Dow has broken out of its prior 10 week trading range but there is still one hurdle it will have to clear before it can make a run up to the 10000 level which is at its 50% Retracement Level near 9500 (point A) which is calculated from the early 2000 high to the October 2002 low. If it can break solidly above 9500 then more than likely it will rally up to its 61.8% Retracment Level which resides at the 10000 level (point B).
The Nasdaq is approaching its mid July high which was around 1775. If it breaks above the 1775 level it will likely rally up to its 200 Weekly EMA (blue line) which is around the 1915 area.
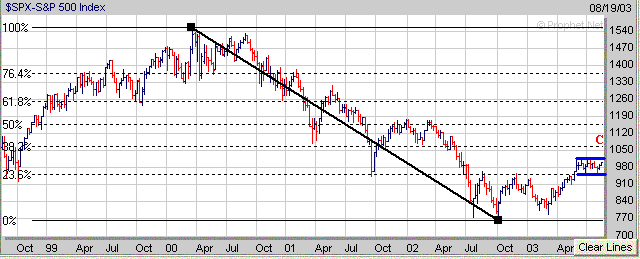
The S&P 500 has been acting the weakest of the 3 major averages and is still below the top of its 10 week trading which is near 1015. If the Dow and Nasdaq are going to follow through to the upside the S&P 500 better start getting its act together soon. If the S&P 500 can break solidly above the 1015 area then its next area of significant upside resistance resides at its 38.2% Retracement Level near 1065 (point C) calculated from the early 2000 high to the low made in October of 2002.
Meanwhile there are two sectors to watch closely the rest of this week which is the Semiconductor's (SOX) and the Banks (BKX).
The SOX closed today right at its 38.2% Retracement near 425 calculated from the early 2000 high to the low made in October of 2002. If the SOX breaks above the 425 level I would look for strong resistance to develop at its 200 Weekly EMA (blue line) near 460.
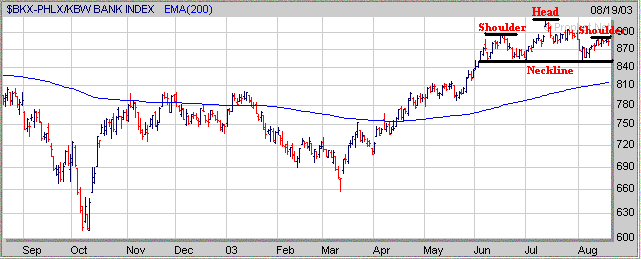
The reason I brought up the Banking sector (BKX) is that it has a lot of weight in the S&P 500. A look at the chart of the BKX shows that it's developing a potentially bearish looking Head and Shoulders Top pattern with the critical support area at the Neckline near 850. This may explain why the S&P 500 is acting weaker than the Dow and Nasdaq so far. If the BKX begins to breakdown this could have a significant impact on the S&P 500 so watch this sector closely.
Finally the Volatility Index (VIX) is continuing to trend lower and is at a level not seen since March of 2002 (Point D). Meanwhile look at what the Dow was doing back in March of 2002 as it also began to break out of an extended trading range (point E) while the VIX continued to make new lows. Shortly thereafter the Dow topped out and which was followed by a sell off (points E to F). This pattern looks remarkably similar to what is occurring now in the Dow.
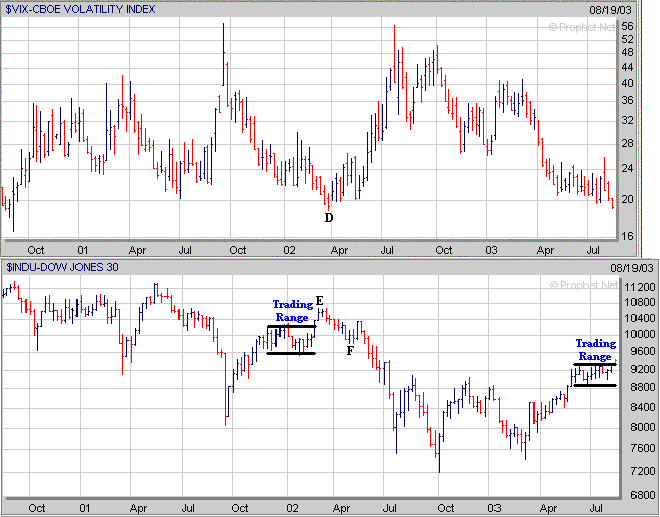
I'm already hearing people say the VIX is an unreliable indicator and doesn't work anymore. My response is maybe this time it will be wrong however I wouldn't bet against it.
Last weekend I gave everyone a freebie as I told you to watch LIOX closely as it had developed a "Cup and Handle pattern". Today it broke out on huge volume (+666% above normal) and above its Pivot Point of $7.25).
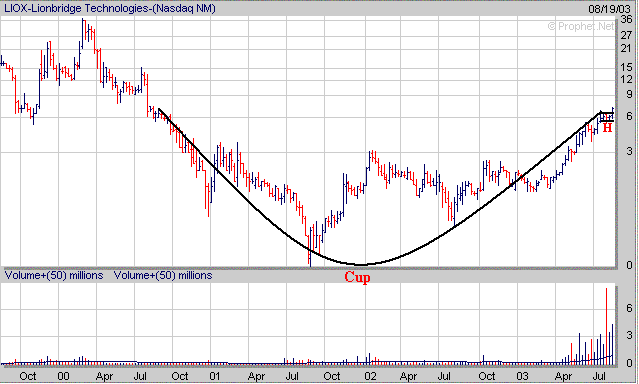
This is one type of chart pattern to look for when screening for stocks. Some others include the "Double Bottom" and Flat Base"