|
Mid Week Market Analysis
(1/11/06)
So far the major averages are holding up well this week after
rallying strongly last week. One reason the Nasdaq has been doing well of
late is the renewed strength in the Semiconductors. A while back I
mentioned the Semiconductor Index (SOX) had developed a Triangle pattern as its
longer term downward and upward sloping trend lines (solid brown lines) were
converging. It now appears the SOX is trying to break out to the upside
from its Triangle pattern. Now there is one key level to watch in the
short term which is just above the 550 level and is where the SOX stalled out at
in early 2004 (point A). If the SOX is able to take out the 550 resistance
area then its next level of upside resistance would be at its longer term 38.2%
Retracement Level near 650 (point B). Thus it will be interesting to see
if the SOX will be able to rise above the 550 area or not in the weeks
ahead. If the SOX were to break above the 550 level and
eventually rally up to its 38.2% Retracement Level near 650 then this would have
a positive impact on the Nasdaq in the longer term. Meanwhile if the SOX
were to stall out near the 550 level and then come under some selling pressure
then this would have a negative impact on the Nasdaq. 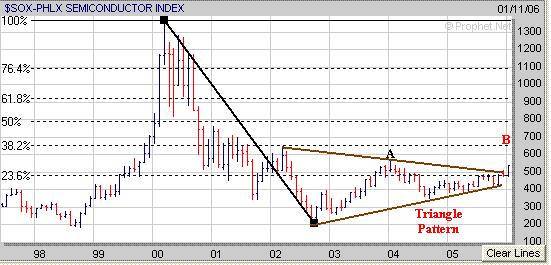
Keep in mind when a stock or an
index develops a Triangle pattern this can lead to a substantial move in one
direction or the other depending on which way the breakout occurs.
Remember in 2005 the Biotechs (BTK) had developed a longer term Triangle pattern
and then broke out to the upside early in the Summer and have been trending
higher since then. Thus we shall see if the Semiconductors can do
the same thing over the next several weeks. 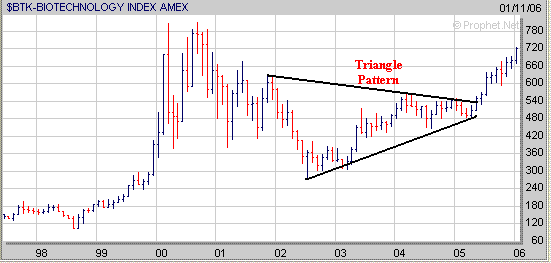
Meanwhile for those of you following
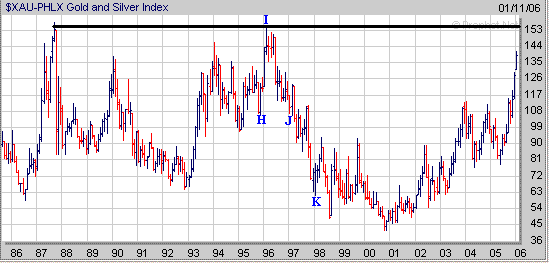
the Gold and Silver sector (XAU) it now looks like the XAU is going to
eventually rally up to its all time high just above the 153 level before much
longer. I would imagine once it gets up to the 153 level that it will
encounter strong resistance and it will be interesting to see what transpires in
the longer term. Keep in mind the last two times the XAU rallied strongly
(points C to D) and reached the 153 level a substantial sell off occurred
shortly thereafter in 1996 and further back in 1987 (points D to
E). 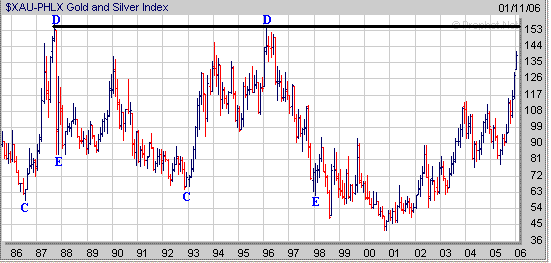
If a similar pattern where to evolve
in the longer term the question is what affect could this have on the major
averages. First let's examine what occurred to the Dow when the XAU
rallied strongly from 1986 through most of 1987 before getting sold off hard
late in the year. As we can see below the Dow rallied strongly as well
with the XAU through most of 1987 but then got sold off hard in tandem with the
XAU in the latter half of the year and lost 41% of its value over an eight
week period beginning in September of 1987. 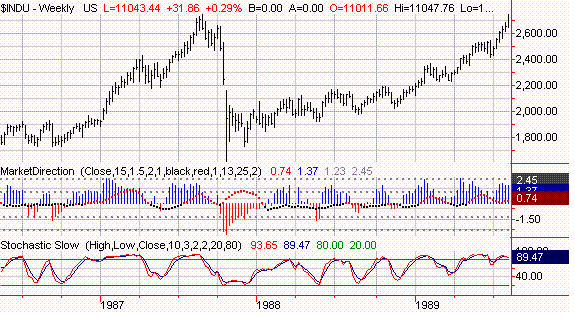
Next we will examine what occurred
to the Dow from 1996 through 1998 when the XAU got sold off hard. As you
can see the Dow rallied in the early part of 1996 (points F to G) as the XAU
continued higher (points H to I) but then the Dow got stuck in a trading range
(solid brown lines) for most of 1996 as the XAU sold off (points I to
J). Meanwhile as the XAU continued to sell off in 1997 (points J to
K) the Dow eventually broke out of its trading range in late 1996 and then
rallied strongly through most of 1997 (points L to M). 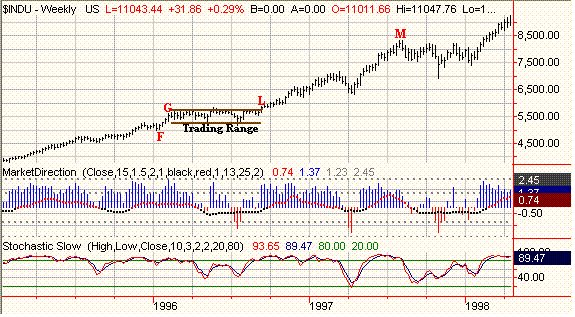
As mentioned above if the XAU
eventually does rally back to its all time high just above 153 it will be
interesting to see if a substantial sell off occurs thereafter and what affect
it may have on the major averages in the longer term. No
matter what eventually evolves in the longer term remember the best stocks to
invest in are those which are exhibiting decent Sales and Earnings Growth that
are breaking out of a favorable Chart Pattern such as the "Cup and
Handle". Stocks that develop a "Cup and Handle" pattern can
do so over a varying amount of time. For example AIRM which is a
stock we featured last October before it broke out developed a 3 year Cup
followed by an 8 week Handle (H). Also notice the increase in volume as
well as AIRM broke out. Since breaking out in early November AIRM has now
gained over 50% from its Pivot Point. 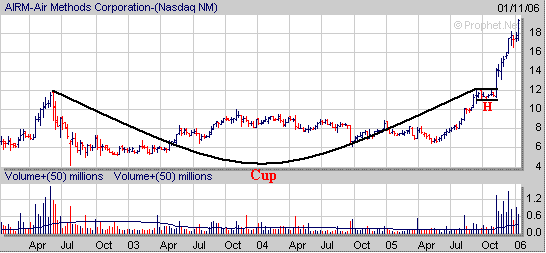
Signup today for a Free
2 Week Trial Membership to amateur-investor.net and have access to our
Stocks to Watch
Buy List which can be used for
either our Short Term or Long Term Investing Strategies.
Click
Here to Signup for a "Free" 2 Week Trial Membership
Amateur-Investor.net
|


