|
Click
Here to Signup for a Free Trial Membership and have access to
our Stocks to Watch List and Daily Breakout Reports
Mid Week Market Analysis
(1/5/05)
Suffice to say 2005 hasn't started out well as the major
averages have sold off accompanied by strong volume. The Dow has fallen
back to its 23.6% Retracement Level (calculated from the late October low to the
December high) near 10600. If the Dow fails to hold support near 10600
then its next support area would either be at its 50 Day EMA (blue line) around
10530 or near 10400 which is where its 38.2% Retracement Level and 100 Day EMA
(green line) come into play at. 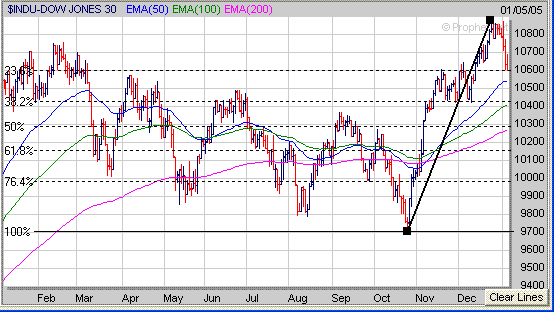
The
Nasdaq is at a key short term support area just below 2100 which coincides with
its 50 Day EMA (blue line) and 23.6% Retracement Level (calculated from the
August low to its December high). If the Nasdaq fails to hold support near
2090 then its next area of support would be in the 2025 to 2040 range which
coincides with its 38.2% Retracement Level and 100 Day EMA (green line). 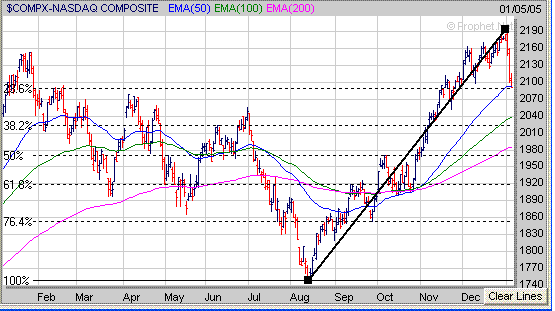
The
S&P 500 is also close to a key short term support area near 1180 which
coincides with its 23.6% Retracement Level (calculated form the August low to
the December high) and 50 Day EMA (blue line). If the S&P 500 fails to
hold support near 1180 then its next area of support would be around 1160 which
coincides with its 38.2% Retracement Level and 100 Day EMA (green
line). 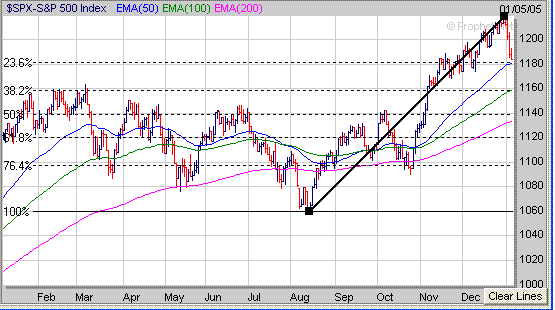
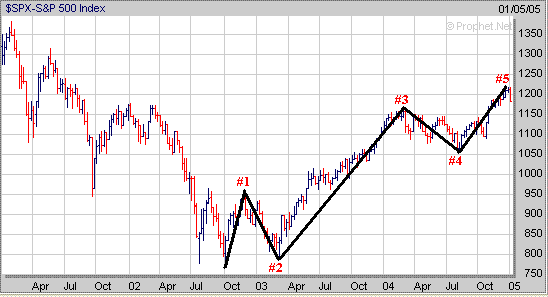
At
this point the question is have the major averages completed their final upward
moving wave to complete an Elliot Wave 5 Wave Pattern or is the recent action
just a normal correction to clear the way for an eventual move higher? 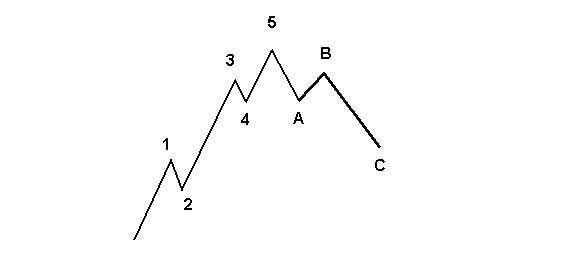
Signup today for a 2
Week Trial Membership and have access to our Stocks
to Watch List which provides a list of Stocks that are exhibiting
favorable Chart Patterns. Each Stock in our Watch List
includes specific Buy and Stop Loss Prices
in addition to Target Prices. For those that like to short
stocks we also a maintain a small list of potential stocks to short as well.
Also you will receive our Daily Breakout Report
by email which Alerts you to Stocks
that are breaking out of a favorable Chart Pattern from our Stocks
to Watch List.
Click
Here to signup for a "Free" 2 Week Trial Membership
Amateur-Investor.net
|


