|
Introductory
Special for New Members
Signup today and save 50% on all our Membership Packages
which include our Stocks to Watch List and Daily Breakout Reports
Mid Week Market Analysis
(6/2/04)
The Dow has broken above short term resistance near 10225 which
coincided with its 50 Day EMA (blue line) and 100 Day EMA (green line).
The next level to watch is around 10300 which is the Dow's 50% Retracement Level
from the February high to the May low. If the Dow can break above 10300
then it may rally up to the 10400 (point A) which corresponds to its 61.8%
Retracement Level and is near its downward sloping trend line (solid red
line). In the near term a key support level to watch will be around
10200. 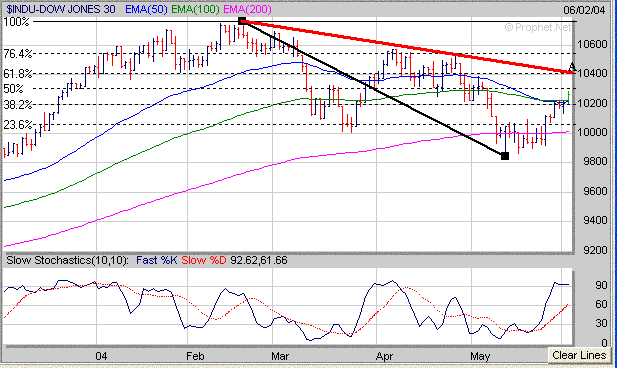
The Nasdaq still remains above its
50 Day EMA (blue line) and 100 Day EMA (green line) in the 1965-1970 range which
is a key short term support area. If the Nasdaq can break above the 2010
area which corresponds to its 50% Retracement Level calculated from the January
high to the May low then it still has a chance to rally up the 2040 level (point
B). The 2040 area is at the Nasdaq's 61.8% Retracement Level and is near its
downward sloping trend line (solid red line). Meanwhile if the Nasdaq
drops below 1965 area then this would likely lead to a drop back to its 200 Day
EMA (purple line) near 1920. 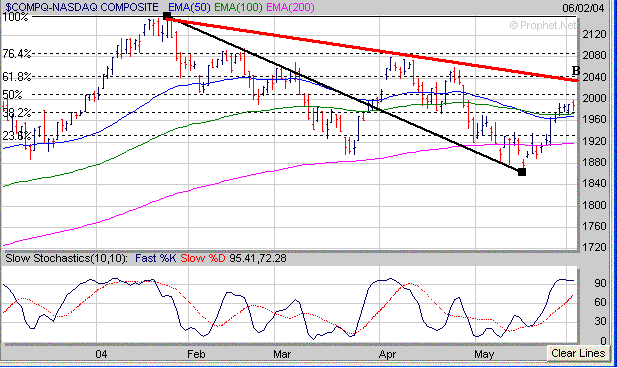
The S&P 500 also remains above
its 50 Day EMA (blue line) and 100 Day EMA (green line). If the S&P
500 can break above the 1130 area, which corresponds to its 61.8% Retracement
Level calculated from the March high to the May low, then it has a chance to
rally up to the 1145 to 1150 range which is where it stalled out at in April.
Meanwhile a key support level to watch in the near term is just above 1110 which
coincides with its 38.2% Retracement Level and 100 Day EMA. 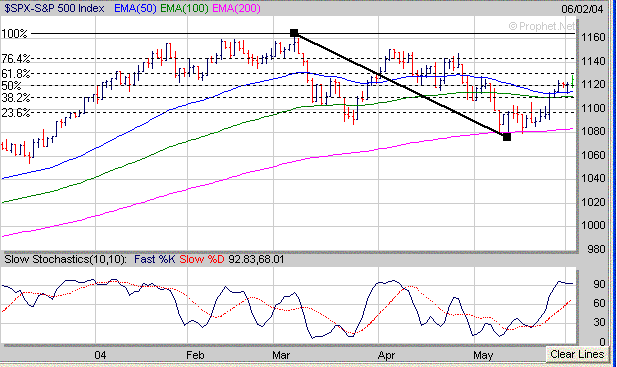
I'm
continuing to watch the Semiconductor Holders (SMH) closely as they have been weak
the past two trading days as they encountered resistance near 38.75 which
coincided with their 100 Day EMA (green line) and 38.2% Retracement Level
calculated from the January high to the May low. The key support area to
watch in the near term is just above 37. If the SMH's break below 37 this
could lead to additional selling pressure in the Nasdaq so it will be important for the
SMH's to hold support above the 37 level the rest of this week. 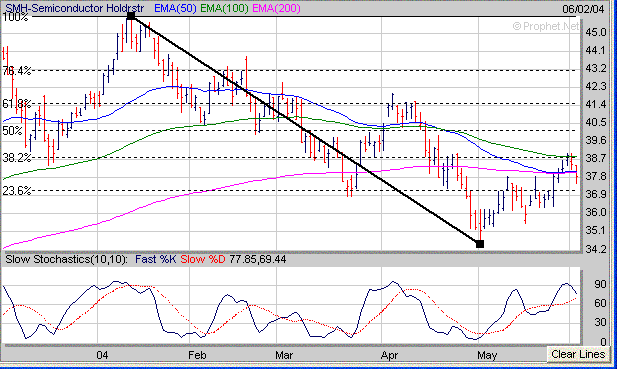
Signup
Today for a "Free" 30 Day Trial Membership and see which Stocks
are developing the best looking Chart Patterns in our current Top
100 List
Amateur-Investor.net
|

