|
Signup
today for
Signup
Today for a "Free" 2 Week Trial Membership
which includes our Stocks to Watch List and Daily Breakout Reports
Mid Week Market Analysis
(9/8/04)
All three major averages are encountering upside resistance
either at specific Moving Averages or at Extension Levels calculated from their
early 2004 highs to the recent August lows. The Dow remains below
its 61.8% Extension Level (calculated from the February high to the August low)
which is just below the 10400 area (point A). The question is at this
point is will the Dow be able to rally above the 10400 level this month or will
it stall out and begin to trend lower? In the near term I would look
for short term support at the Dow's 50% Extension Level near 10260. If the
10260 level is broken then look for a quick drop back to the 10160 area which is
where the Dow's 50 Day EMA (blue line),100 Day EMA (green line) and 38.2%
Extension Level come into play at. Meanwhile if the the Dow can hold
support near 10260 and attempts to go higher look for upside resistance just
below 10400 which is at its 61.8% Extension Level. If the
Dow can break above 10400 then it could rally up to either 10500 (June high) or
10525 (76.4% Extension Level). 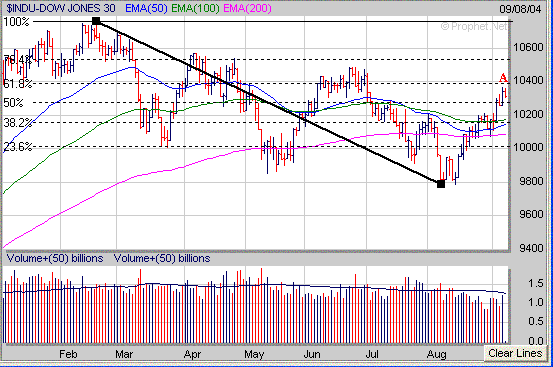
The Nasdaq has stalled out right at
its 50 Day EMA (blue line) near 1875 and has a key short term support area near
1840. If the 1840 support area is broken then look for the next support
area around 1820 (point B). If the Nasdaq breaks below 1820 this would likely
lead to a retest of the August low near 1750 at some point in September.
Meanwhile if the Nasdaq can hold short term support near 1840 and rally above
its 50 Day EMA then it could make a quick move up to 1905 or so which is where
its 100 Day EMA (green line), 200 Day EMA (purple line) and 38.2% Extension
Level all reside at (point C). 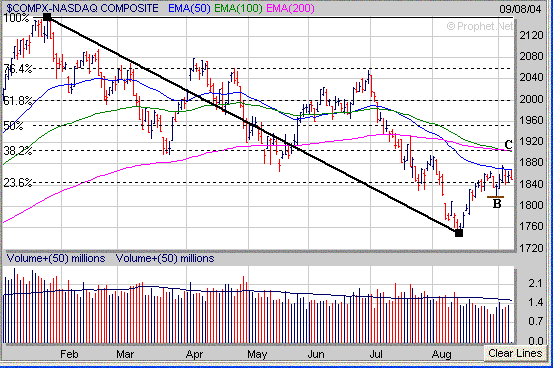
The key thing that will likely
influence the Nasdaq the most is the Semiconductors which have been weak of
late. If the Nasdaq is going to make a move up to the 1905 level this
month the Semiconductor Holders (SMH) need to hold support near 28 (point D) and
attempt to rally off of this level. 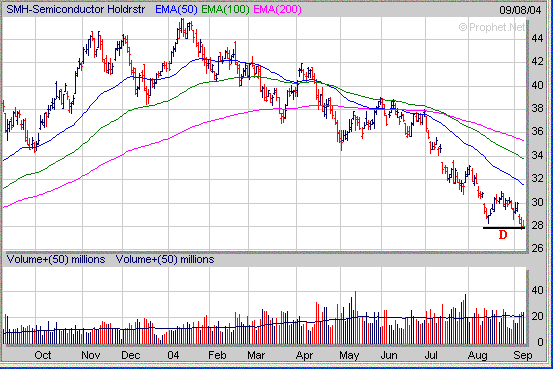
If the SMH's fail to hold support
near 28 which is close to their longer term 61.8% Retracement Level (calculated
from the October 2002 low to the January 2004 high) then look for a drop back to
their 76.4% Retracement Level near 24 (point E) which would lead to additional
selling pressure in the Nasdaq. 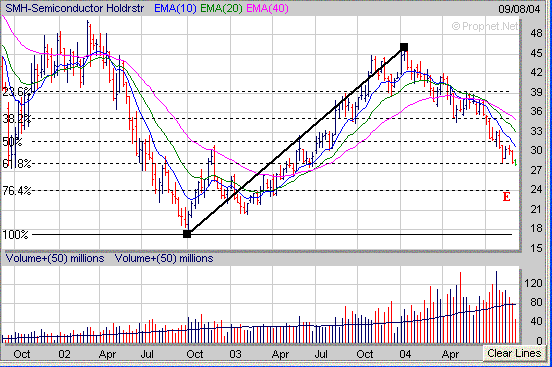
As far as the S&P 500 it has
encountered resistance at its 61.8% Extension Level (calculated from the March
high to the August low) near 1023 (point F). The question is at this point
is will the S&P 500 be able to rally above its 61.8% Extension Level and
eventually rally up to its 76.4% Extension Level near 1140 (point G) in the days
ahead or will it stall out and drop back to the 1095 to 1105 area which is where
its 200 Day EMA (purple line), 100 Day EMA (green line) and 50 Day EMA reside
at? 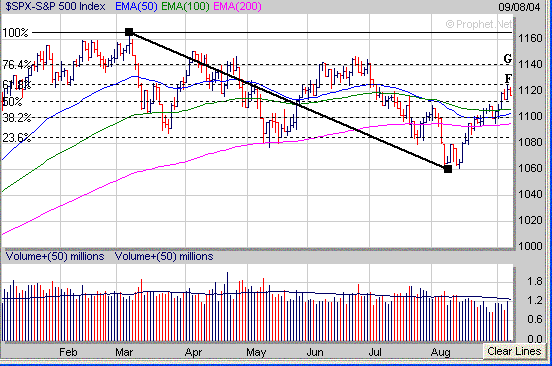
Finally recognizing chart patterns
is a major factor in determining which stocks to possible invest in. Some
of the classic chart patterns include the "Cup and Handle",
"Double Bottom" and "Flat Base". However another chart
pattern to look for is a "Triangle" pattern which is sometimes
referred to as a Symmetrical Triangle or Pennant pattern. TZOO
has exhibited three separate Triangle patterns during the past five
months. A Triangle pattern occurs when a stocks downward and upward trend
lines (show as black lines) begin to converge. This type of pattern is
usually followed by a significant move in one direction or the other at some
point. In the case of TZOO all three Triangle patterns led to a
significant upward move (points H to I). 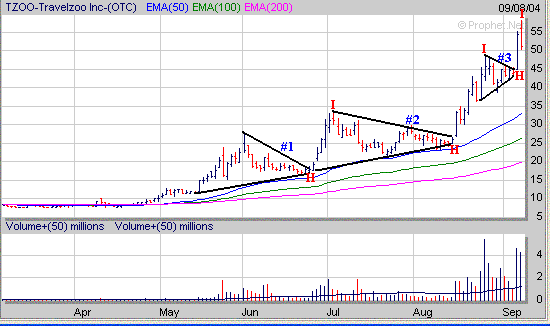
Signup
Today for a "Free" 2 Week Trial Membership
and see which Stocks are currently forming a favorable Chart Pattern
Amateur-Investor.net
|


