Volatility Index nears all time Low
The Volatility Index (VIX) dropped to 9.39 on Friday December 15th
which is very close to the record low made on December 22, 1993 when it fell to
9.31. This means investors have become extremely complacent which may
not hurt the market too much in the near term but could spell trouble in
the longer term based on what happened in late 1993 into the early part of 1994.
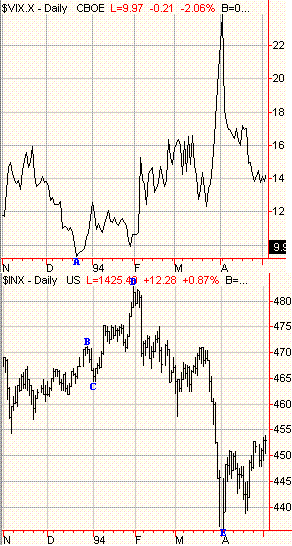
A daily chart of the Volatility Index (VIX) versus the S&P 500 from late 1993 into
the early part of 1994 is shown below. Keep in mind up until the Fall
of 2003 there was only one daily value for the VIX so I have used a line
chart to display those values. As you can see the VIX reached its all
time low in the 3rd week of December just prior to the Christmas Holiday (point
A). The S&P 500 shortly thereafter then went through a brief 3
day correction (points B to C) after Christmas before rallying strongly through January
of 1994 (points C to D). This was then followed by a 10% correction
in the S&P 500 from February through March of 1994 (points D to E).
If the current pattern we are seeing goes through a similar scenario like
occurred from late 1993 into the early part of 1994 then we may see a
brief sell off either next week or the week after which will then be
followed by more upside movement in the S&P 500 through
January of 2007. However after that we probably should be on the look out
for a substantial correction in the February through March timeframe.
Click
here to Signup for a
"Free" 4 Week Trial Membership to Amatuer Investors
and have access to the following Products
Stocks to Watch Buy List
Daily ETF Buy and Sell Signals
401K/TSP Timing Signals
Industry Group Performance
Market Timing Indicator
Daily ETF Signals
|

