
Weekend Market Analysis
(1/11/03)
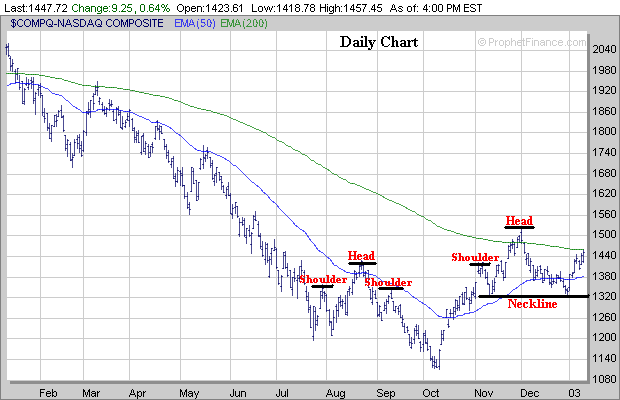
Despite the major averages (Dow, Nasdaq and S&P 500) ending up for the week the question remains will the major averages follow through to the upside and confirm a Bullish "Double Bottom" pattern or will they stall out leading to a Bearish looking "Head and Shoulders Top" pattern over the next week or two.
Once again let's analyze the current chart patterns of the major averages from both a Bullish and Bearish perspective. From a Bullish point of view the major averages are still exhibiting a potential Double Bottom pattern and are trying to rally out of four week Handle. As I mentioned last weekend in order for the Double Bottom pattern to be confirmed the major averages must break above their December 2nd highs which are acting as the key Pivot Points. These levels are near 9100 (Dow), 1520 (Nasdaq) and 960 (S&P 500). If the major averages can rally above these levels accompanied by good volume then this would be a Bullish sign for the longer term.
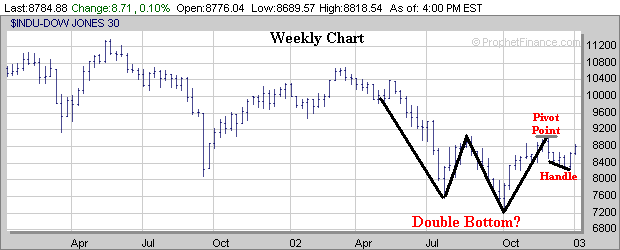
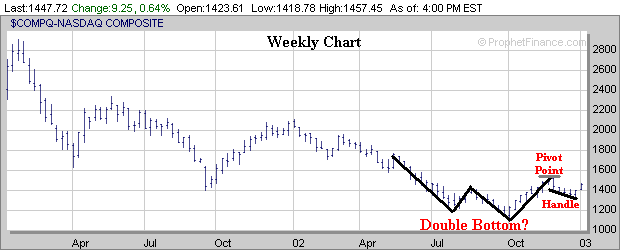
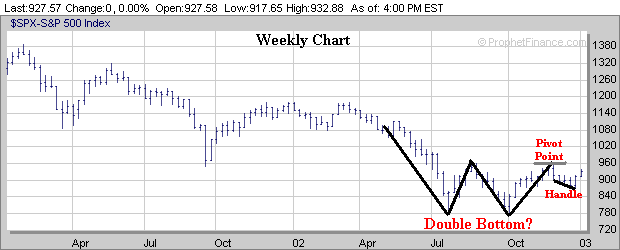
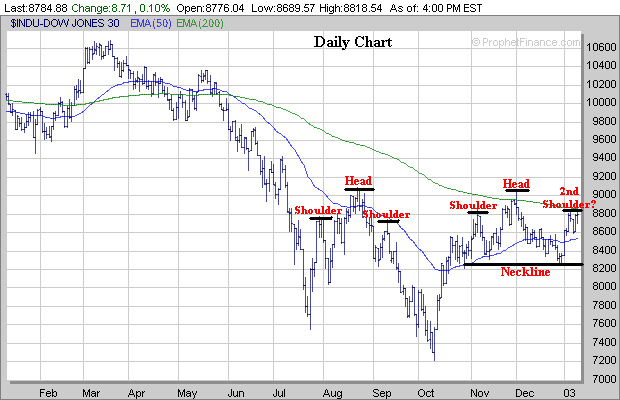
Now let's look at the major averages from a Bearish perspective. It also could be argued that the major averages may be developing potential Head and Shoulder Top patterns similar to what transpired last Summer into the early Fall.
In order for the Dow to negate its potential Head and Shoulders Top pattern it must rally above its 200 Day Exponential Moving Average (EMA) next week near 8850. If it doesn't then this could lead to the formation of the 2nd Shoulder.
The Nasdaq has rallied back to its 200 Day EMA (green line) near 1460 and needs to break convincingly above it next week to negate its potential Head and Shoulders Top pattern.
As for the S&P 500 it needs to rally break strongly above the 933 level next week to negate a potential Head and Shoulders Top pattern as well. If it doesn't then this could lead to the formation of the 2nd Shoulder.
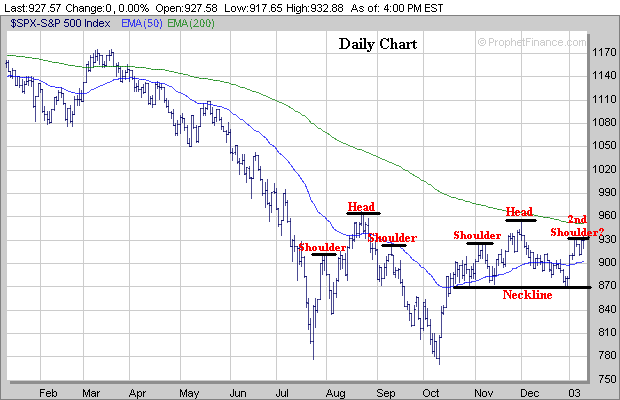
Thus from what I can see it appears next week may end up being a crucial week for the major averages. If they stall out near their current levels and begin to sell off then the Bearish looking Head and Shoulders Top pattern would be confirmed. However if the major averages can rally strongly upward from their current levels then that would be a Bullish sign.
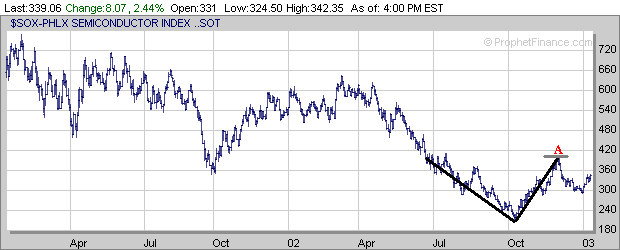
A couple of things which make me somewhat nervous is the chart of the Semiconductor Index (SOX) from both a short and long term perspective and the Volatility Index (VIX). The two year chart of the SOX shows that it has formed a "V" bottom instead of a potential "W" bottom. "V" bottoms aren't as constructive of a chart pattern as compared to "W" bottoms. For the SOX to become Bullish in the longer term it will have to rally above its December 2nd high around 390 (point A).
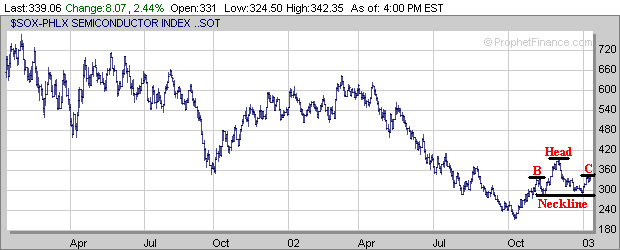
Meanwhile if we look at the shorter term it appears the SOX may be developing a Bearish looking Head and Shoulders Top pattern with the two Shoulders defined by points B and C. To nullify this potential Head and Shoulders Top pattern the SOX will have to rally strongly above its 2nd Shoulder (point C) around the 345 level next week.
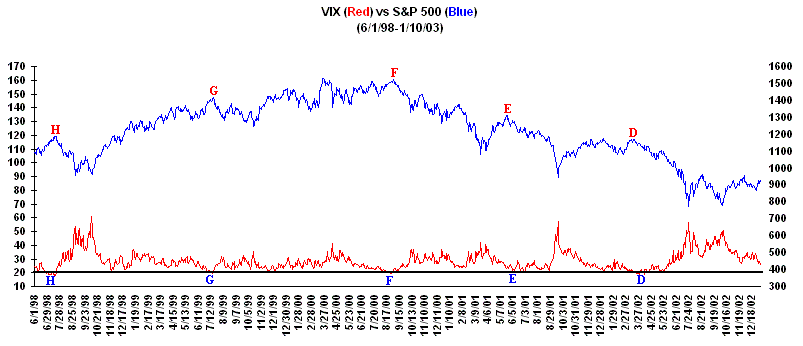
The Volatility Index (VIX) continues to drop and if this downward bias remains intact could spell potential trouble down the road. Over the past five years an extremely low reading in the VIX (around 20) has signaled a nearing top followed by a sell off in many cases (points D, E, F, G and H). Thus watch the VIX closely over the next few weeks for any further downside momentum.
No matter what transpires in the weeks ahead continue to focus on those stocks which are breaking out of favorable chart pattern such as "Cup and Handles", "Double Bottoms" and "Flat Bases".
Signup Today for a "Free" 2 Week Trial Membership and receive our Daily Breakout Reports
| ||||||