Signup Today for a
"Free" 2 Week Premium Trial Membership to amateur-investor.net
and see which Stocks to Focus on in 2003
Weekend Market Analysis
(1/18/03)
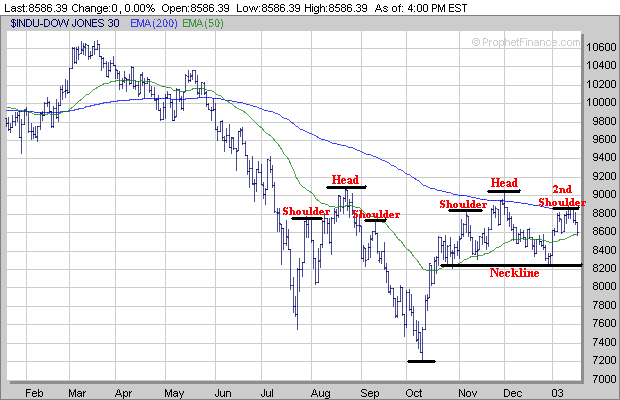
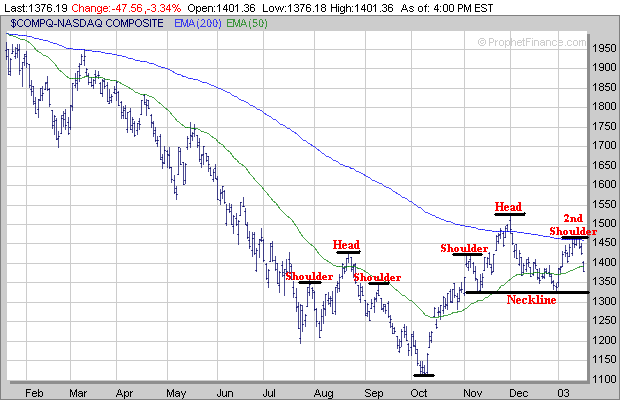
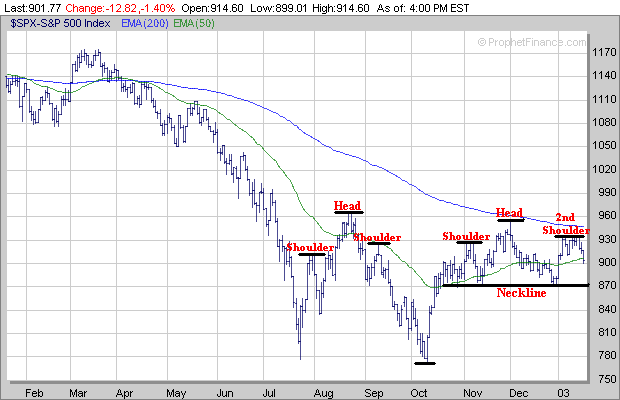
The major averages (Dow, Nasdaq and S&P 500) have now
completed the 2nd Shoulder of a bearish looking Head and Shoulders Top pattern
which looks similar to what occurred in the Summer of 2002.
The Dow ran into strong resistance near its 200 Day Exponential
Moving Average (EMA) around 8850 early last week which led to the development of
its 2nd Shoulder. By the end of the week the Dow had dropped back to its
50 Day EMA (green line) which was near 8600. If the Dow is unable to hold
support near its 50 Day EMA then the next major support area would be at its
Neckline in association with its Head and Shoulders Top pattern near
8250.
The Nasdaq ran into strong resistance early last week near its
200 Day EMA (blue line) near 1460 which allowed for the development of its 2nd
Shoulder. By the end of the week the Nasdaq had dropped below its 50 Day
EMA (green line) near 1390. If the Nasdaq continues lower the next major
support is at its Neckline in association with its Head and Shoulders Top
pattern in the 1320-1325 range.
The S&P 500 stalled out early last week just above the 930
level which led to the development of its 2nd Shoulder and by the end of the
week had broken below its 50 Day EMA (green line) near 905. If the S&P
500 continues lower the next major support area is at its Neckline in
association with its Head and Shoulders Top pattern around 870.
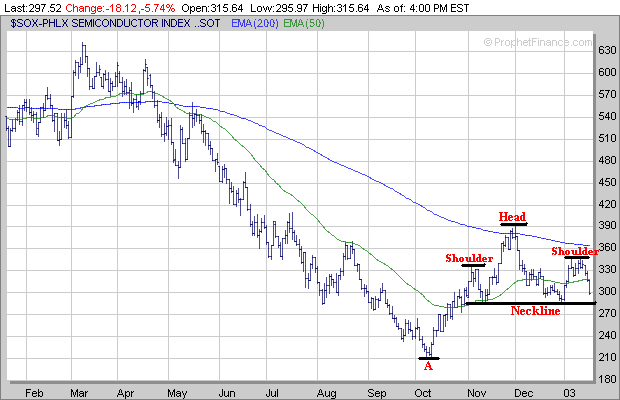
Meanwhile the Semiconductor Index (SOX) is also exhibiting a
bearish looking Head and Shoulders Top pattern as well. The key level to
watch in the SOX is around 285 which is the Neckline support area in association
with its Head and Shoulders Top pattern. If the SOX breaks below its
Neckline then this will likely lead to a retest of its early October 2002 low
near 210 (point A).
What is even more bothersome too me at this point is the amount
of complacency and lack of fear being exhibited by a few of the Contrarian
Indicators. The % difference between the Bearish (point B) and Bullish
(point C) Investment
Advisors still shows a wide gap between the two which has existed for several
weeks now.
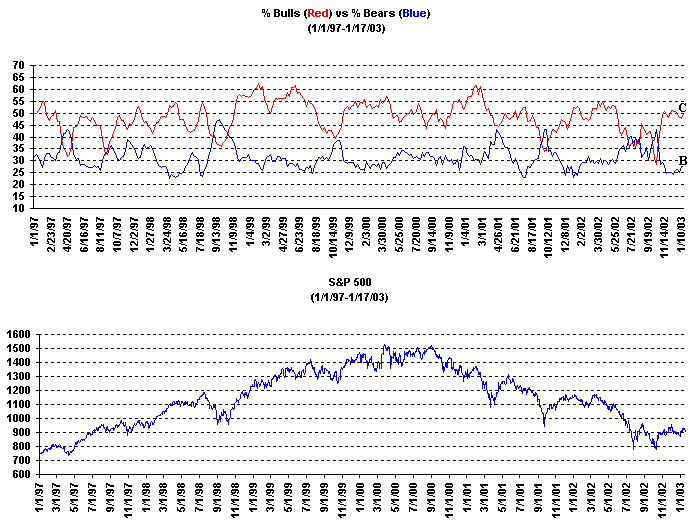
Furthermore the Volatility Index (VIX) still remains at a very low
level (point D) and didn't rise much this past week despite the weakness in the market.
With the Contrarian Indicators showing an absence of fear in the
market and the major averages exhibiting bearish looking Head and Shoulder Top
patterns the potential for more downside pressure appears high. The key thing
to watch over the next week or two will be if the major averages can hold
support near their Necklines which are 8250 (Dow), 1320-1325 (Nasdaq) and 870
(S&P 500).
Signup Today for a
"Free" 2 Week Trial Membership and receive our Daily Breakout Reports
|


