
Weekend Market Analysis
(1/25/03)
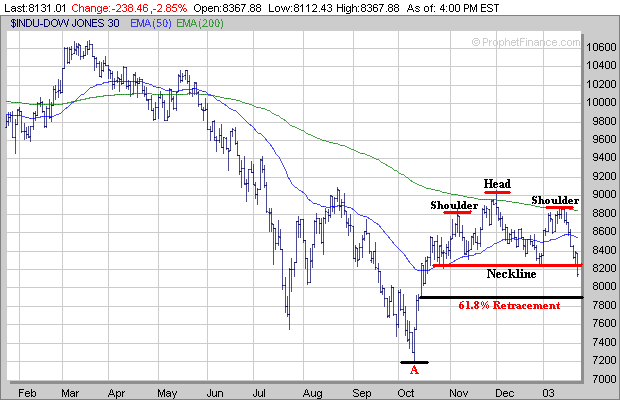
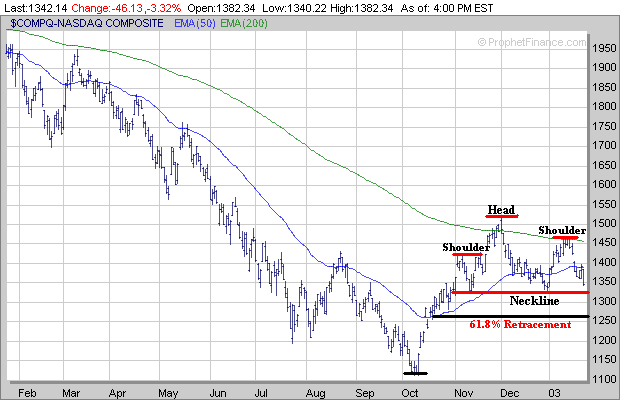
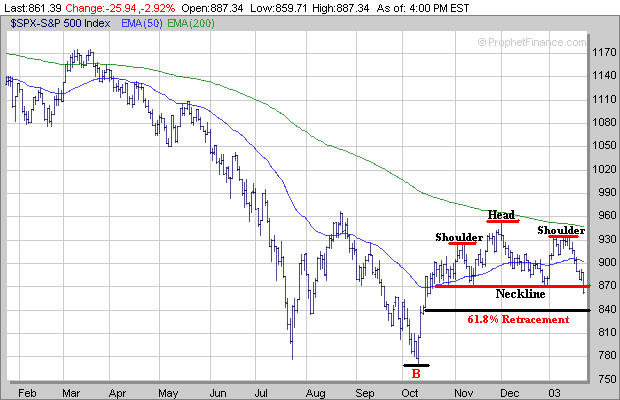
Those of you that have read this column for the last several weeks know there were two possible scenario's that could evolve. One was Bearish and the other was Bullish. Unfortunately it appears the Bearish scenario is playing out. All three major averages (Dow, Nasdaq and S&P 500) continue to exhibit bearish looking Head and Shoulder Top patterns. Furthermore both the Dow and S&P 500 broke below critical support areas on Friday at their Necklines.
If the Dow continues lower the next area to watch for support and a possible bounce would be at its 61.8% retracement level from the October 10th low to the December 2nd high which is around 7900. If the Dow fails to hold support near 7900 then the next major support level would be the October 10th low near 7200 (point A).
As for the Nasdaq the first key support area to watch next week is in the 1320-1325 range along its Neckline. If the Nasdaq breaks below its Neckline then the next support area would be at its 61.8% retracement level from the October 10th low to the December 2nd high near 1265.
Meanwhile if the S&P 500 continues lower the next support level to watch is at its 61.8% retracement level from the October 10th low to the December 2nd high around 840. If the S&P 500 fails to hold support near the 840 level then the next major support area would be the October 10th low around 770 (point B).
As far as the Contrarian Indicators none of the three that I pay attention too are showing signs yet of extreme pessimism or panic that is normally associated with a nearing bottom. The Put to Call Ratio is still below a value of 1.0 and needs to rise significantly above 1.0 to signal a nearing bottom.
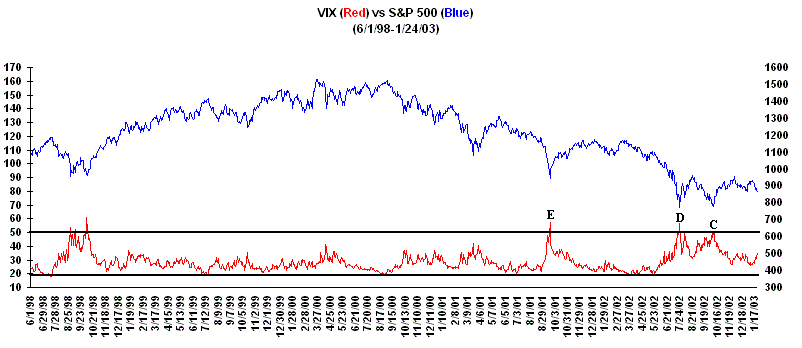
Meanwhile the Volatility Index (VIX) which has begun to rise is still well below a level that has signaled a nearing bottom in the past. Notice that during the last three significant market reversals the VIX rose to a value of 50 or above (points C, D and E).
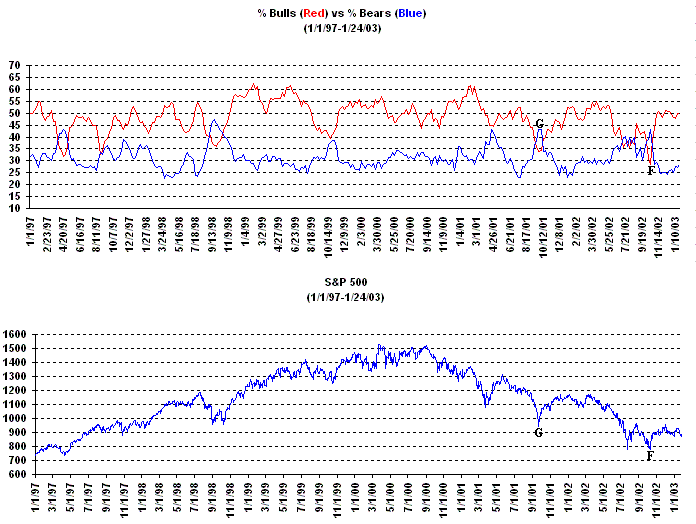
Furthermore the Bullish-Bearish Indicator shows that the % difference between the Bullish and Bearish Investment Advisors remains quite high despite the sell off in the market over the past week or so. What you would like to see is for this % difference to narrow like occurred this past Fall and in the Fall of 2001 (points F and G).
Although things look pretty ominous at the moment it's important keep an eye on those stocks which are holding up well especially during a sell off because when the market does finally make a bottom and reverse strongly to the upside they may become the next market leaders. If you don't believe this then I would read my latest monthly article below which shows some examples of what occurred last Fall.
The Importance of Noticing which Stocks are Holding up Well during a Market Sell Off
| ||||||