
Weekend Market Analysis
(1/4/02)
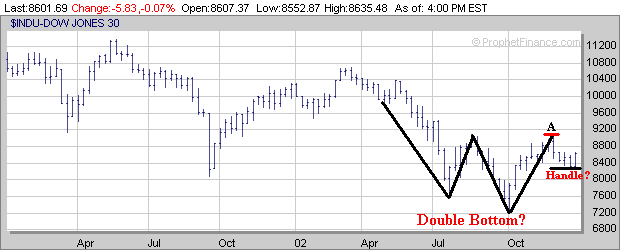
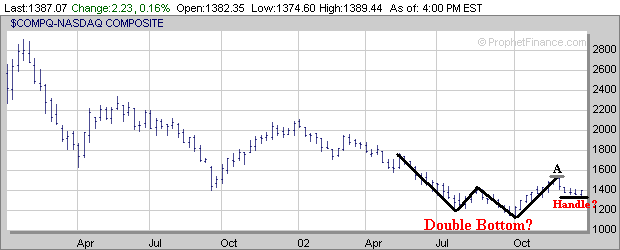
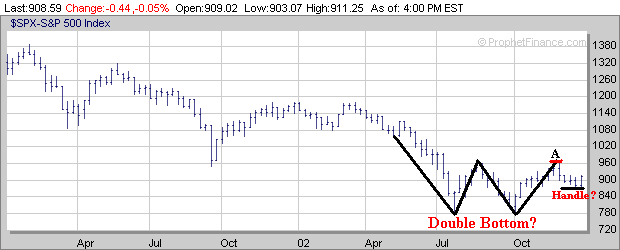
The question for 2003 is will the potential Double Bottom patterns that the major averages developed over the last several months pan out or will they fail to follow through to the upside? The 2 Year Weekly Charts of the Dow, Nasdaq and S&P 500 are shown below. Since early December the major averages have been in a multi-week pullback after rallying strongly from October until early December. If we look at things from a Bullish perspective it appears that the major averages may be developing Handles after forming potential Double Bottom patterns (looks like the letter "W"). The key thing to watch over the next few weeks is if the major averages can rally out of their Handles and break above their early December highs (points A) which were near 9100 (Dow), 1520 (Nasdaq) and near 960 (S&P 500). If they can break above their early December highs then this would be very Bullish and could lead to another significant move upward in the longer term.
Meanwhile if we take a Bearish perspective the major averages could be developing potential Head and Shoulder Top patterns much like occurred during the Summer and early Fall of 2002. After the major averages failed to hold support along their Necklines this lead to a 1000 point drop in the Dow, 150 point drop in the Nasdaq and a 100 point drop in the S&P 500 before making a bottom in early October. The key thing to watch over the next week or two is if the major averages stall out near their 1st Shoulders which are around 8850 (Dow), 1425 (Nasdaq) and 925 (S&P 500). If they do stall out near these levels then this would allow for the formation of their 2nd Shoulders and complete their Head and Shoulder Top patterns which would be a Bearish sign for the longer term especially if the Neckline support areas near 8200 (Dow), 1320 (Nasdaq) and 870 (S&P 500) are broken.
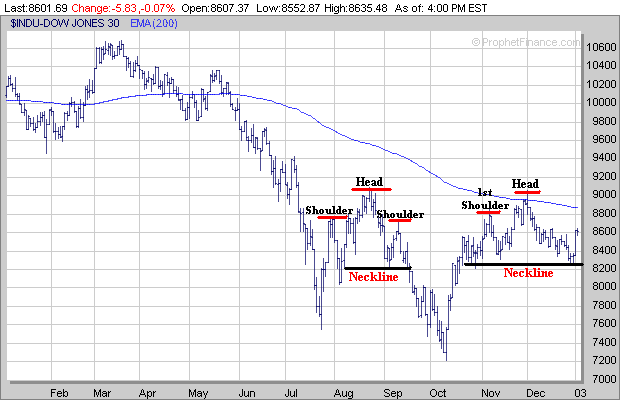
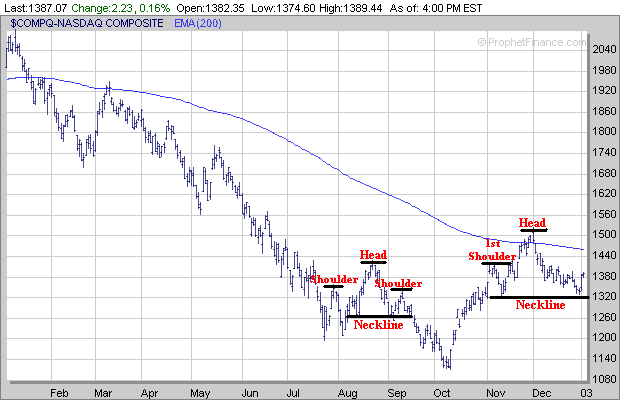
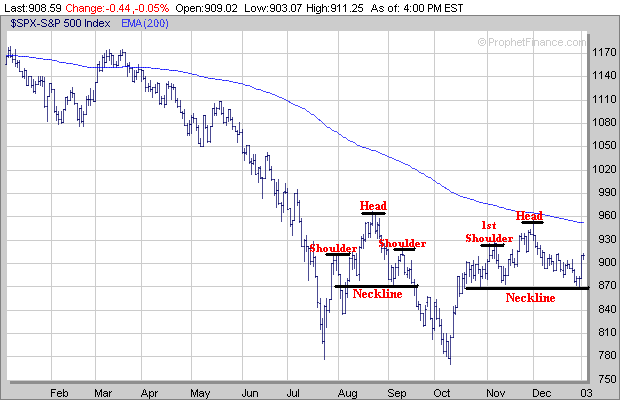
Thus it appears we have two possible scenario's developing as we start the early part of 2003 with one being potentially Bullish and the other potentially Bearish. At this point it's not clear which scenario will pan out and all we can do is watch how things evolve over the next few weeks.
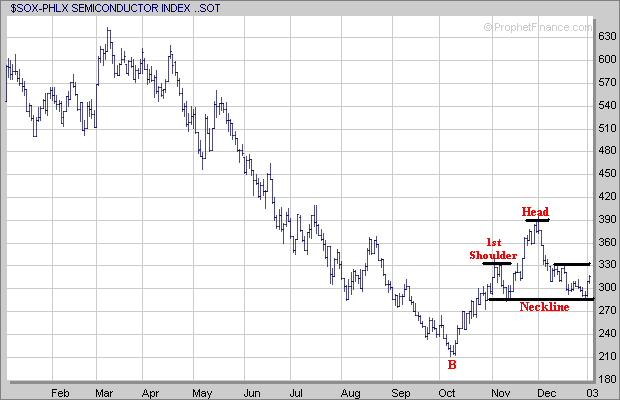
Meanwhile one another thing that is of some concern is the chart of the Semiconductor Index (SOX) which also may be developing a Head and Shoulders Top pattern especially if the SOX stalls out near the 330 level. The key support area on the SOX is around 285 which is along its Neckline. Any break below the Neckline in the weeks ahead would likely lead to a retest of the early October low near 210 (point B).
| ||||||