
Signup Today for a
"Free" 2 Week Premium Trial Membership to amateur-investor.net
by
filling out the form below and see which Stocks to Focus on in 2003.
(One Free Trial Membership per Person per Year)
Weekend Market Analysis
(2/15/03)
It appears we may get a short term bounce from very oversold conditions based on Thursday's reversal day which did follow through on Friday. However I will caution you that it may not last long and eventually a retest of the October 10th lows is still a strong possibility.
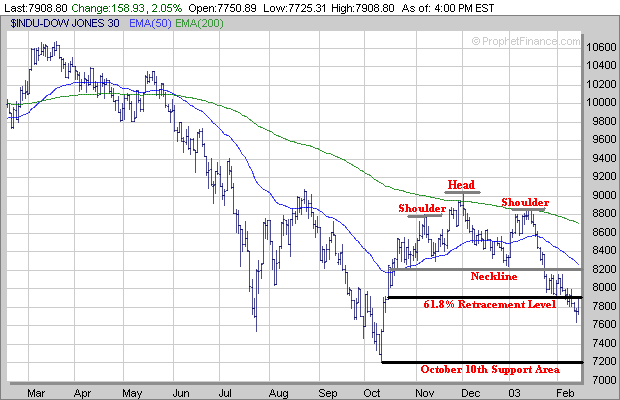
The Dow closed on Friday right at its 61.8% retracement level (near 7900) from its October 10th low to its December 2nd high. If the Dow can break above the 7900 level then a rise back to its Neckline (near 8200) in association with its Head and Shoulders Top pattern is possible in the near term. In addition the Dow's 50 Day Exponential Moving Average (EMA) is also approaching the Neckline so I would expect the Dow to encounter significant resistance on any short term bounce near the 8200 level. Meanwhile if the bounce from oversold conditions doesn't follow through next week and the Dow begins to reverse to the downside again the next major support level would be the October 10th low near 7200.
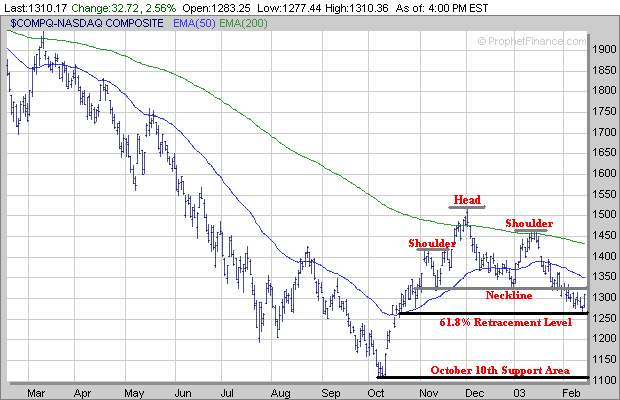
The Nasdaq bounced off its 61.8% retracement level (near 1265) on Thursday and then followed through to the upside on Friday. If the Nasdaq continues to bounce from oversold conditions in the near term the first area of resistance to the upside exists at its Neckline in association with its Head and Shoulders Top pattern near 1325. If the Nasdaq can rally above the 1325 level then it will encounter even stronger resistance at its 50 Day EMA (blue line) near 1350. Meanwhile if the Nasdaq isn't able to break above its Neckline near 1325 and begins to reverse to the downside next week look for support near the 1265 level. If the Nasdaq breaks below the 1265 level then it will likely retest its October 10th low near 1110 in the weeks ahead.
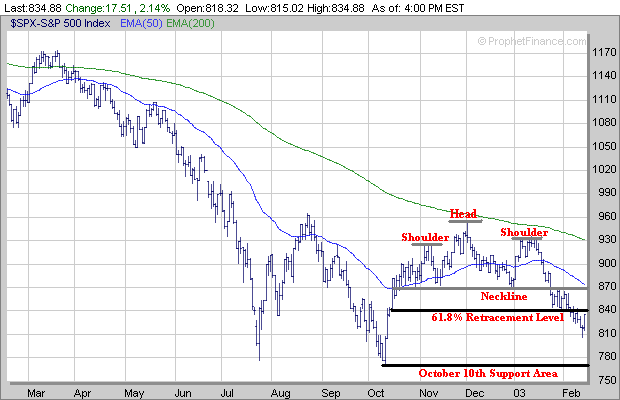
The S&P 500 followed through to the upside on Friday as well and is approaching its first area of possible resistance at its 61.8% retracement level near 840. If the S&P 500 can rally above the 840 level in the near term it could rise back to around the 870 level which is where its 50 Day EMA (blue line) is approaching the Neckline in association with the S&P 500's Head and Shoulders Top pattern. Meanwhile if the S&P 500 stalls out near the 840 level instead and then reverses to the downside this could eventually lead to a retest of the October 10th low near 770.
As far as the Contrarian Indicators the Put to Call Ratio continues at fairly high levels however the Volatility Index (VIX) still hasn't been able to break significantly above the 40 level yet.
As I have stated before over the past few years significant
reversals have not occurred in the market until the VIX has risen to 50 or above
(points A, B and C). This is one reason why I think the major averages may
still have go lower before a major bottom develops. 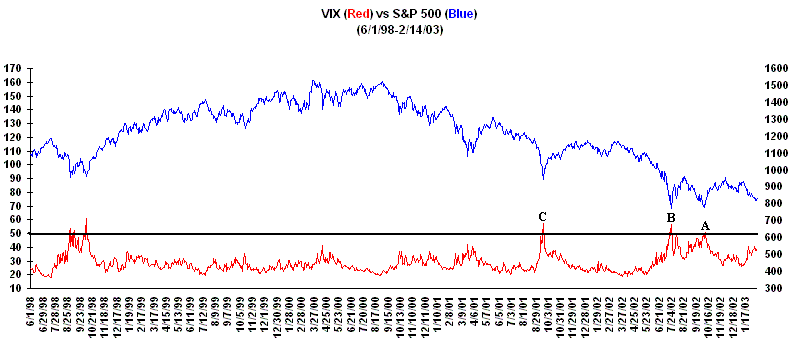
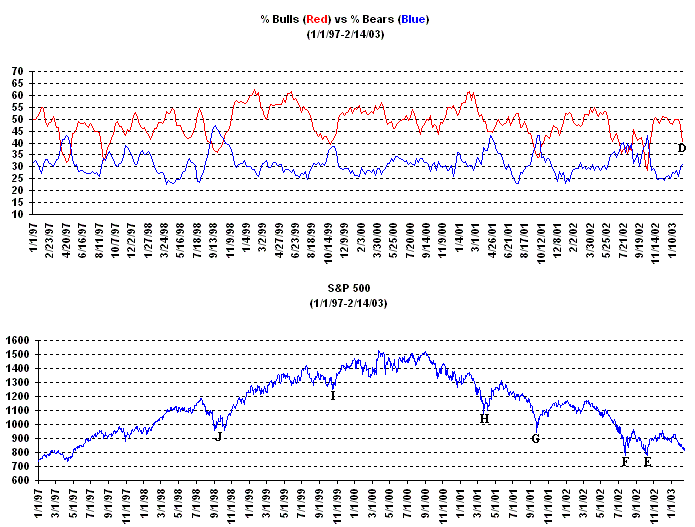
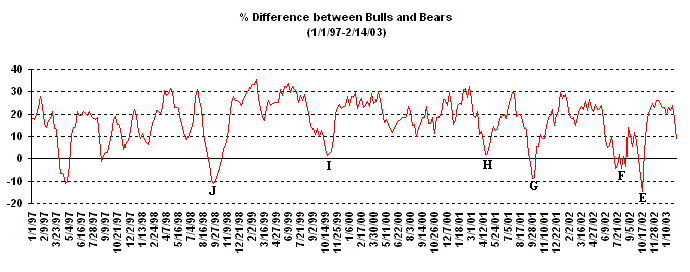
Meanwhile there was a positive development in the Bullish-Bearish Sentiment this past week as the % of Bullish Investment Advisors dropped considerably (point D) while the % of Bearish Investment Advisors increased. In the past when the % of Bullish Investment Advisors has been less than or equal to the % of Bearish Investment Advisors a market bottom has occurred followed by a sharp rally (points E, F, G, H, I and J). Although the current % difference between the Bullish and Bearish Investment Advisors is around 9% it's encouraging to see the gap beginning to narrow.
Although we could see some type of short term bounce next week I still think the major averages may have to eventually retest their October 10th lows before enough fear develops in the market to allow for a major bottom to occur.
If you have enjoyed reading our free Mid Week and Weekend Market Reports over the past three years we are asking for a small yearly donation to help pay for some of the costs to produce these reports each week. This is strictly a volunteer request and doesn't mean you have to donate to keep receiving our free Mid Week and Weekend Market Reports each week. If you would like to donate please click on the button below.
Each person who makes a donation will also receive a "Free"
2 Week Trial Premium Membership
which includes our Daily Breakout Reports and Stocks to Watch list.
| ||||||