
Weekend Market Analysis
(2/1/03)
Not much has changed as the major averages are still exhibiting Bearish looking Head and Shoulder Top patterns. The market tried to bounce somewhat this week from oversold conditions but basically the major averages went nowhere despite all of the daily volatility.
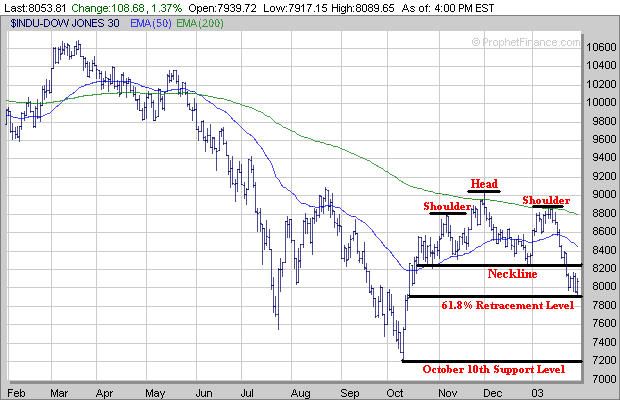
The Dow remains well below its 200 Day and 50 Day Exponential Moving Averages (EMA) but so far has found support near its 61.8% retracement level from the October 10th low to its December 2nd high near 7900. If the Dow attempts to rally in the short term look for initial resistance at its Neckline in association with its head and Shoulders Top pattern near 8250. Meanwhile if the Dow breaks below the 7900 level then the next major area of support would be the October 10th low near 7200.
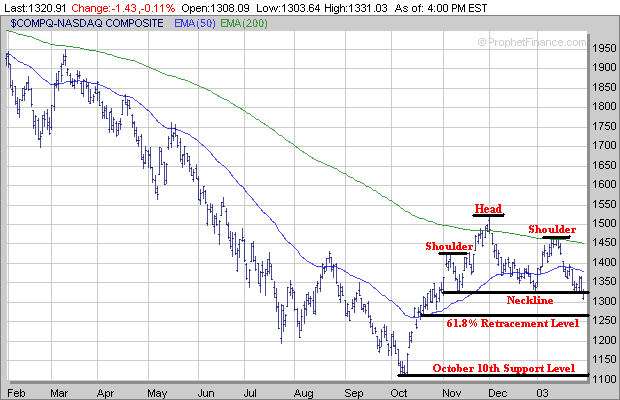
The Nasdaq is also below its 200 and 50 Day EMA's and broke below its Neckline on Friday near 1320 but did manage to close near it by the end of the day. If the Nasdaq attempts to rally in the short term there will be strong resistance at its 50 Day EMA (blue line) near 1375. Meanwhile if the Nasdaq heads lower the next area of support would be around 1265 which is the 61.8% retracement from the October 10th low to its December 2nd high. Any break below the 1265 level would lead to a retest of the October 10th low near 1110 which would be the next major support level below 1265.
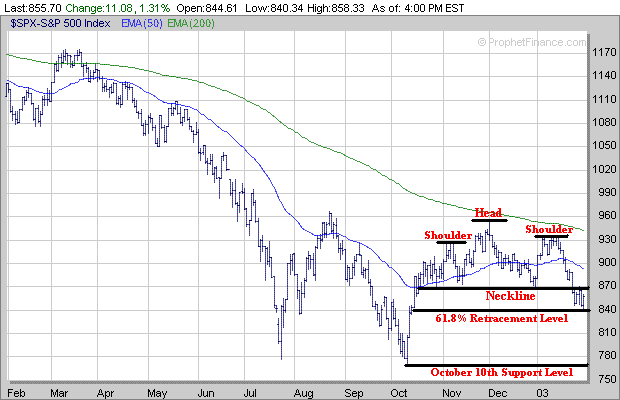
The S&P 500 is no different than the Dow and Nasdaq as its well below its 200 and 50 Day EMA's as well. The S&P 500 did bounce off its 61.8% retracement level from the October 10th low to its December 2nd high on Friday at 840. If it tries to mount a rally in the short term look for initial resistance at its Neckline in association with its head and Shoulders Top pattern near 870. Meanwhile if the S&P 500 breaks below the 840 level the next major support area would be the October 10th low near 770.
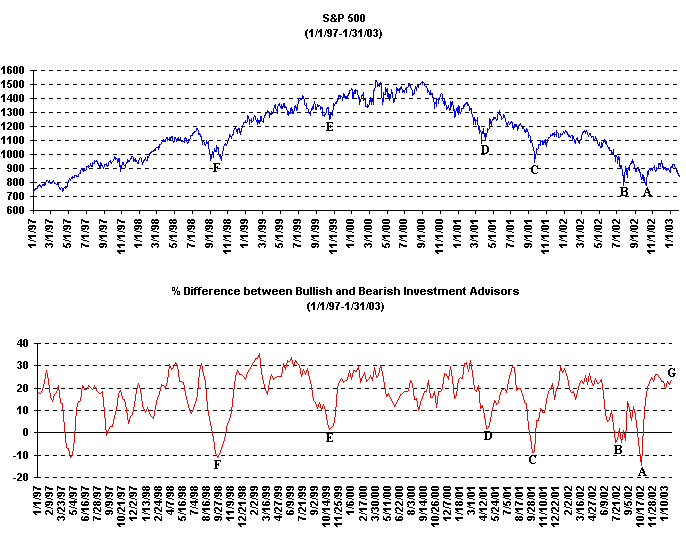
What continues to bother me is the amount of complacency that still exists among the professional Investment Advisors, as shown by the % difference between the Bullish and Bearish Advisors, which still remains very high despite the weakness in the market over the past few weeks. As you can see below over the past few years major reversals in the market have occurred when the % difference between the Bullish and Bearish Investment Advisors has trended towards zero or below. Some examples include this past Fall and Summer (points A and B), the Fall of 2001 (point C), Spring of 2001 (point D), the Fall of 1999 (point E) and in the Fall of 1998 (point F). Currently the % difference between the Bullish and Bearish Investment Advisors is around 24% (point G) which indicates there is still quite a bit of complacency in the market.
Meanwhile the Volatility Index (VIX) despite trending higher over the past few weeks (point H) also remains below a key level (generally above 50) which has signaled abundant fear in the market and a nearing bottom in the past. Some recent examples include this past Fall and Summer (points I and J) and the Fall of 2001 (point K).
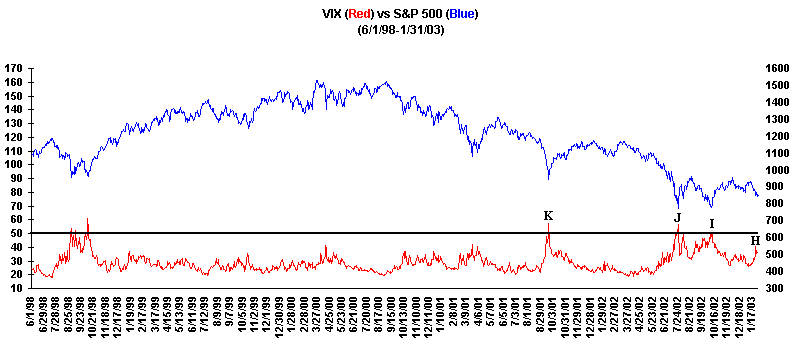
Although these two Contrarian Indicators aren't 100% perfect they have worked fairly well in the past. With neither of them showing signs yet of extreme fear in the market there may continue to be more selling pressure in the weeks ahead. If the major averages do eventually retest or drop below their October 10th lows hopefully this would be enough to excessive fear in the market leading to a potential bottom.
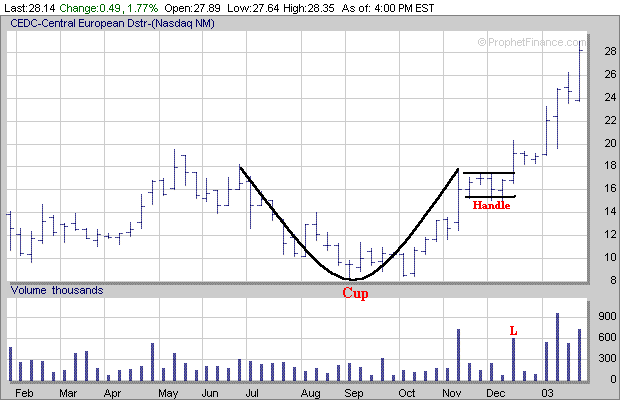
Finally even in a negative market environment a few stocks can still do well as shown by the example CEDC below. CEDC is somewhat unique as it gave investors two different buying opportunities on its way upward. CEDC initially formed a 4 month Cup followed by a 4 week Handle before breaking out in mid December on strong volume (point L).
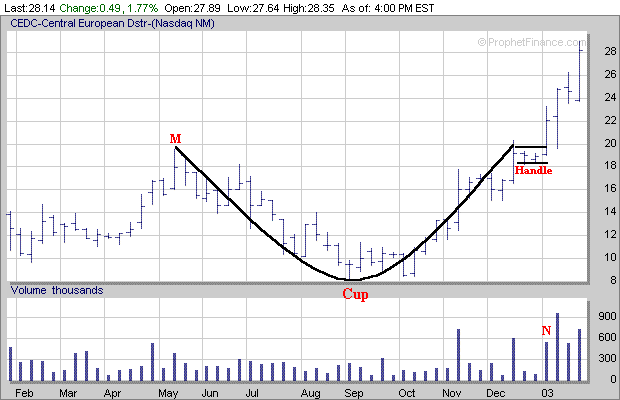
CEDC than rallied from $16 to $20 before encountering resistance near its previous 52 week high near $20 that occurred in May of 2002 (point M). This resulted in the development of a 2nd Cup spanning 7 months and a smaller 2 week Handle which CEDC then broke out of in early January accompanied by strong volume (point N) once again. Since breaking out in mid December CEDC has appreciated over 75% during the past 7 weeks.
No matter how bad the market may appear it's still important to keep track of those stocks which are holding up well and are experiencing good sales and earnings growth as this can provide a list of stocks which may perform the best once the market starts acting well.
If you have enjoyed reading our free Mid Week and Weekend Market Reports over the past three years we are asking for a small yearly donation to help pay for some of the costs to produce these reports each week. This is strictly a volunteer request and doesn't mean you have to donate to keep receiving our free Mid Week and Weekend Market Reports each week. If you would like to donate please click on the button below.
| ||||||