
Weekend Market Analysis
(2/22/03)
So far the bounce from oversold conditions continues to hold up although the volume associated with this short term rally has been on the low side. Meanwhile all three major averages (Dow, Nasdaq and S&P 500) are hovering near short term resistance levels which will be discussed below.
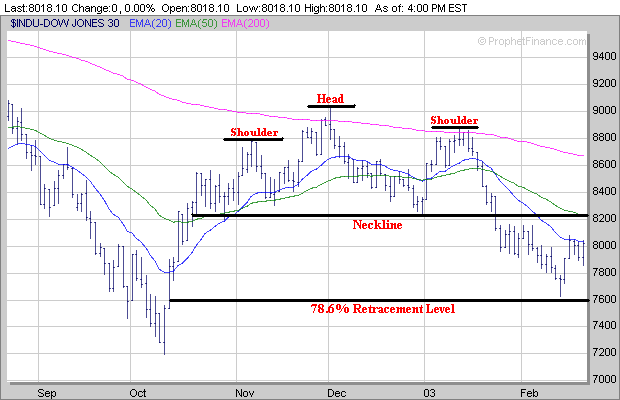
The Dow which got close to its 78.6% Fibonacci Retracement Level near 7600 (calculated from the October 10th low to the December 2nd high) is encountering resistance near its 20 Day Exponential Moving Average (EMA). If the Dow can rise above its 20 Day EMA (blue line) then it appears the next significant area of resistance to the upside would be near 8250 which is at the Dow's Neckline in association with its Head and Shoulders Top pattern and 50 Day EMA (green line).
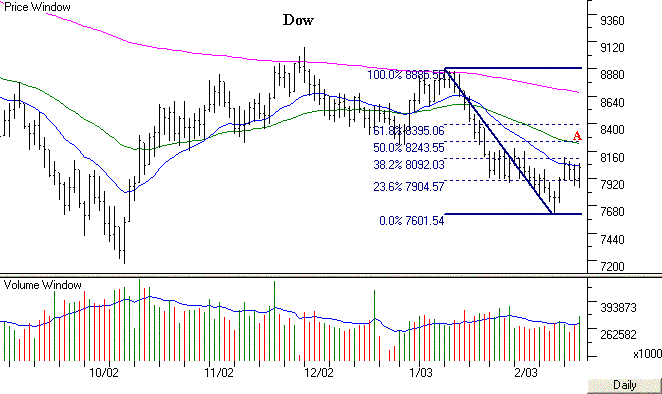
In addition if we take a look at the Fibonacci Retracement Levels (calculated from the mid January high to the mid February low) the 50% Retracement Level also exists near the 8250 area (point A) as well. Thus the 8250 level will likely act as a significant resistance area for the Dow if it breaks above its 20 Day EMA. Meanwhile if the Dow fails to rise above its 20 Day EMA and reverses to the downside instead then it will likely drop back to 7600 level.
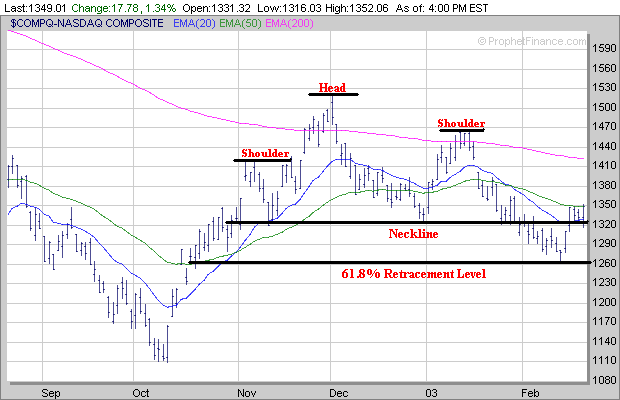
The Nasdaq which bounced off its 61.8% Fibonacci Retracement Level near 1260 (calculated from the October 10th low to the December 2nd high) is encountering resistance near its 50 Day EMA (green line) around 1350. If the Nasdaq can rise above its 50 Day EMA it appears the next major resistance area would be at its 200 Day EMA (purple line) near 1420.
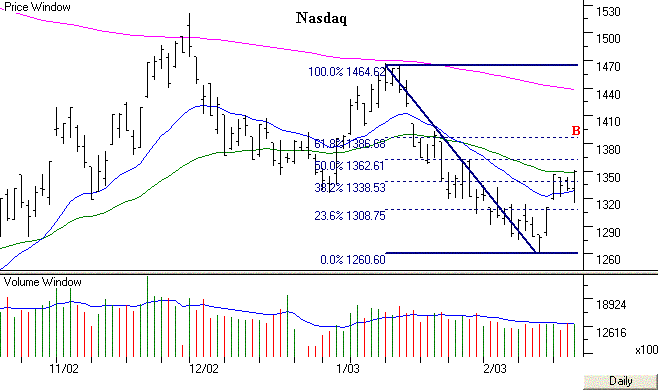
However an analysis of the Fibonacci Retracement Levels (calculated from the January high to the February low) indicate the Nasdaq could encounter additional resistance at its 61.8% Retracement Level near 1387 (point B). Meanwhile if the Nasdaq is unable to rally above its 50 Day EMA and reverses to the downside instead it will likely drop back to the 1260 level.
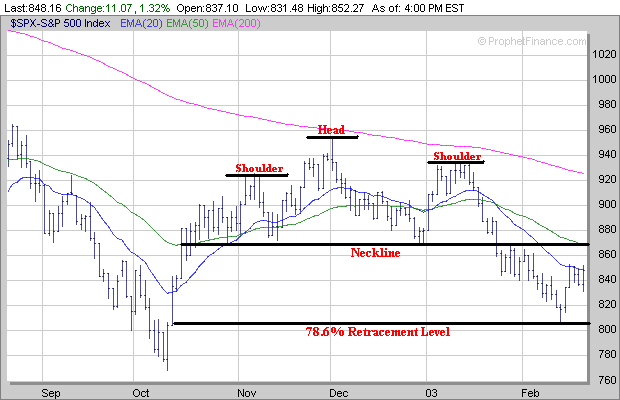
The S&P 500 which bounced off its 78.6% Fibonacci Retracement Level near 805 (calculated from the October 10th low to the December 2nd high) is encountering some resistance at its 20 Day EMA (blue line) near 850. If the S&P 500 can rise above its 20 Day EMA then the next significant area of resistance to the upside is around the 870 level which is where its Neckline, in association with its Head and Shoulders Top pattern, and 50 Day EMA (green line) have converged at.
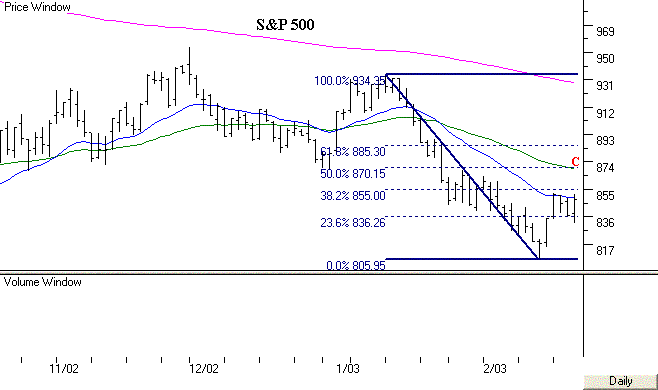
In addition an analysis of the Fibonacci Retracement Levels (calculated from the January high to the February low) show that the 50% Retracement Level also exists near the 870 area (point C) as well. Thus there are quite a few things coming together around the 870 level which may provide significant resistance for the S&P 500. Meanwhile if the S&P 500 is unable to rise above its 20 Day EMA and begins to reverse to the downside instead then it will likely drop back to around the 805-810 range.
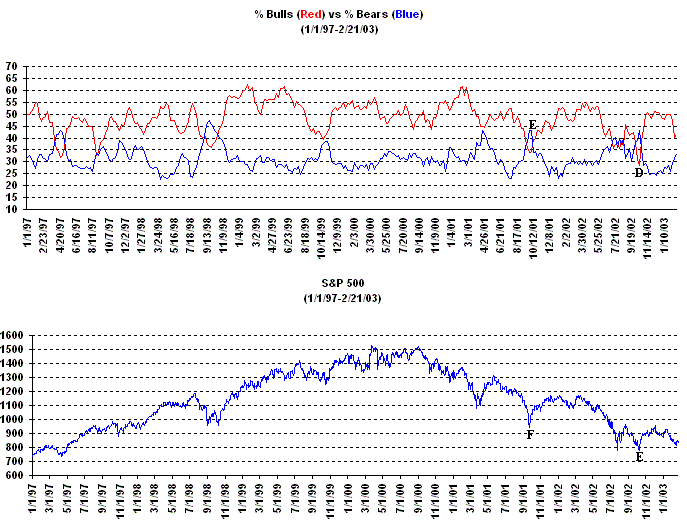
Next looks take a look at a few of the Contrarian Indicators. The Bullish-Bearish Sentiment readings continue to show the % difference between the Bullish and Bearish Investment Advisors narrowing. What we would like to see is for the % difference between the two to trend toward zero or actually have the % of Bullish Investment Advisors less than the % of Bearish Investment Advisors which could signal a nearing bottom. Some examples include this past Fall (point D) and back in the Fall of 2001 (point E).
Meanwhile the Volatility Index (VIX) still shows there hasn't been an excessive amount of fear generated in the market yet as the VIX reading still remains below the 50 level. In the past when the VIX has risen at or above the 50 level this has led to some significant bottoms such as last Summer and Fall (points F & G) and further back in the Fall of 2001 (point H).
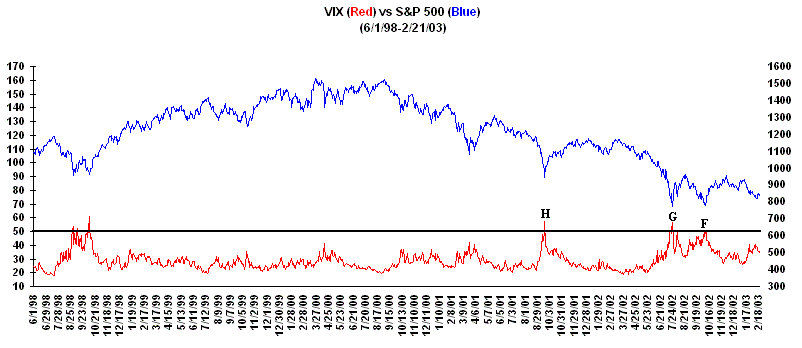
At this point I'm not sure enough fear has been generated yet in the market to signal a major bottom and with the market rallying on rather low volume this could eventually spell trouble.
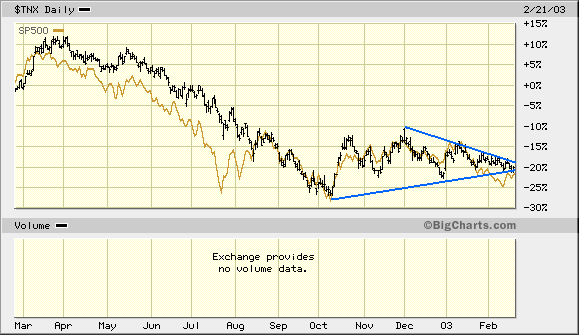
Finally as mentioned in the Mid Week Analysis the trading range in the 10 Year Bond (TNX) has been narrowing over the past few months as the upward and downward sloping trend lines (blue lines) have been converging. This tells me that a significant move to the upside or downside in the TNX may be nearing. As shown by the chart below the TNX and the S&P 500 have been basically mirroring each other over the past year.
If you have enjoyed reading our free Mid Week and Weekend Market Reports over the past three years we are asking for a small yearly donation to help pay for some of the costs to produce these reports each week. This is strictly a volunteer request and doesn't mean you have to donate to keep receiving our free Mid Week and Weekend Market Reports each week. If you would like to donate please click on the button below.
Each person who makes a donation will also receive a "Free"
2 Week Trial Premium Membership
which includes our Daily Breakout Reports and Stocks to Watch list.
| ||||||