
Weekend Market Analysis
(3/1/03)
The market seems to be waiting on what will eventually transpire with Iraq and until this issue is resolved peacefully or by a US led invasion it's probably going to be difficult for the major averages to sustain any type of multi-week rally.
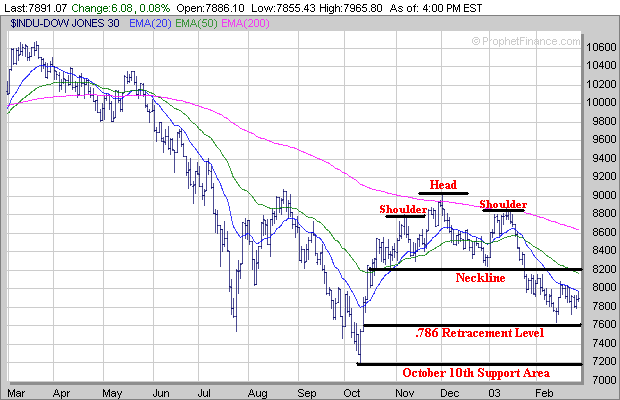
The Dow has been encountering resistance near its 20 Day Exponential Moving Average (EMA) over the past few weeks after bouncing off its .786 Retracement Level near 7600 (calculated from the October 10th low to the December 2nd high). In the near term there are two possible scenario's for the Dow. If the Dow can break above its 20 Day EMA (blue line) then it could rally up to the 8200 level which is its next level of significant resistance that corresponds to its Neckline (associated with the Head and Shoulders Top pattern) and 50 Day EMA (green line). Meanwhile if the Dow begins to trend downward again look for initial support near 7600 (.786 Retracement Level). If the Dow breaks below the 7600 level then its next area of support would be its October 10th low near 7200.
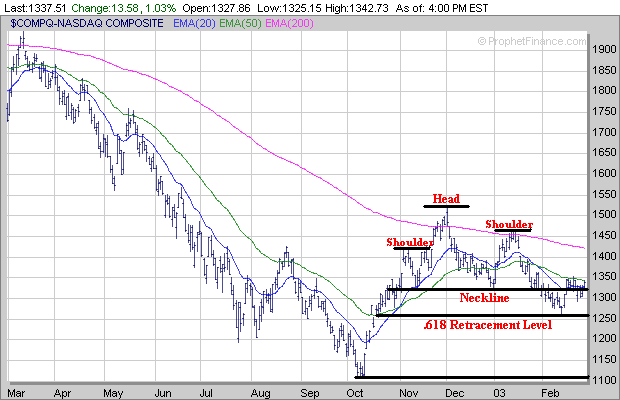
The Nasdaq so far has has been encountering resistance near its 50 Day EMA (green line) after finding support at its .618 Retracement Level near 1260 (calculated from the October 10th low to the December 2nd high). If the Nasdaq can break convincingly above its 50 Day EMA then the next area of significant resistance would appear to be at its 200 Day EMA (purple line) near 1425.
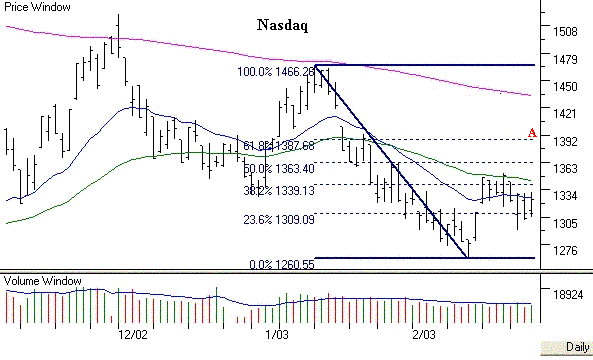
However as I pointed out last weekend there is another potential area of resistance near 1388 (point A) which is at the .618 Retracement Level (calculated from the January high to the February low) which could come into play before the Nasdaq reaches its 200 Day EMA. Meanwhile if the Nasdaq is unable to break above its 50 Day EMA and begins to trend lower look for initial support around the 1260 level.
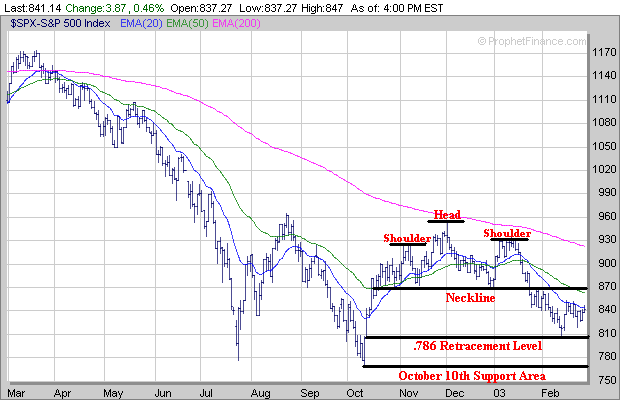
The S&P 500 has also had a difficult time rallying above its 20 Day EMA (blue line) after bouncing off its .786 Retracement Level near 805 (calculated from the October 10th low to the December 2nd high). If the S&P 500 can rally above its 20 Day EMA then it could rise up to around the 870 level which will provide the next area of significant resistance which corresponds to its Neckline (associated with its Head and Shoulders Top pattern) and 50 Day EMA (green line). Meanwhile if the S&P 500 fails to rally above its 20 Day EMA and begins to trend lower look for initial support near the 805 level (.786 Retracement Level). If the S&P 500 breaks below the 805 area then its next area of support would be at its October 10th low near 770.
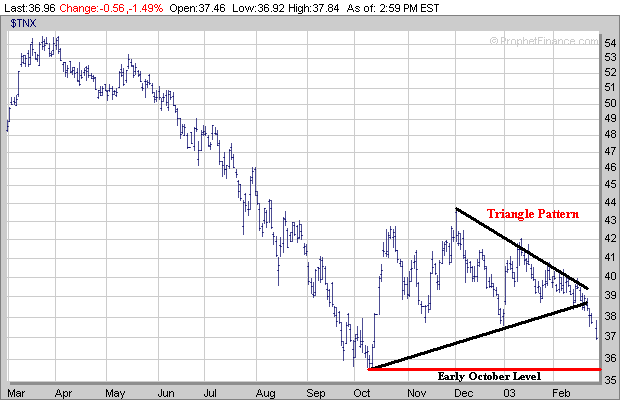
Meanwhile as I talked about last weekend the chart of the Ten Year Bond (TNX) showed that it was forming a triangle pattern as the downward and upward sloping trend lines (black lines) were converging which was a signal too me that a significant move was coming. Notice this past week there was s significant move in the TNX as it broke below its upward sloping trend line an now appears to be headed back towards its early October level near 35 1/2.
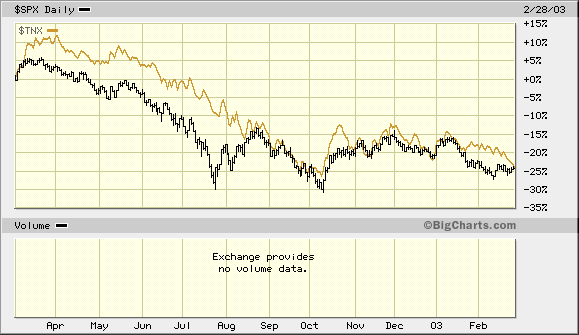
Thus it appears money is flowing back into Bonds which could lead to more downside pressure in the major averages. Once again if we compare the S&P 500 to the TNX they have generally been trending in the same direction over the past year.
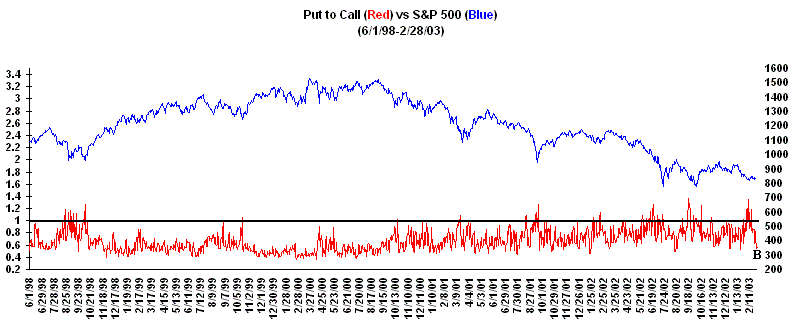
Furthermore the Put to Call Ratio dropped significantly this past week (point B) as the option players are becoming increasingly complacent.
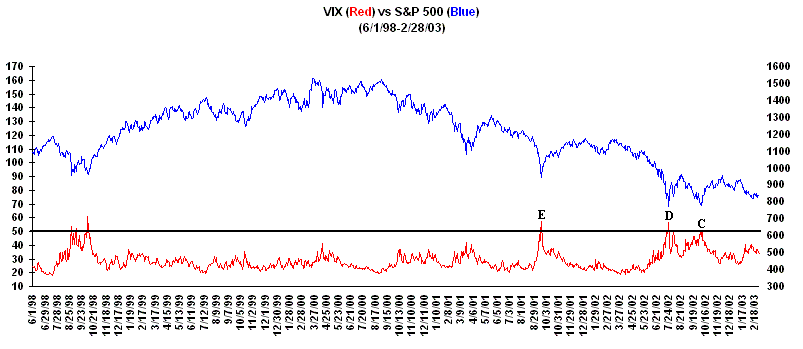
Meanwhile the Volatility Index (VIX) has remained in a range between 34 and 41 over the past month or so and hasn't reached a value yet (>=50) which has signaled a nearing bottom in the past few years (points C, D and E). Now this doesn't mean the VIX has to rise to 50 or above but I would be much more convinced of a nearing bottom if it did.
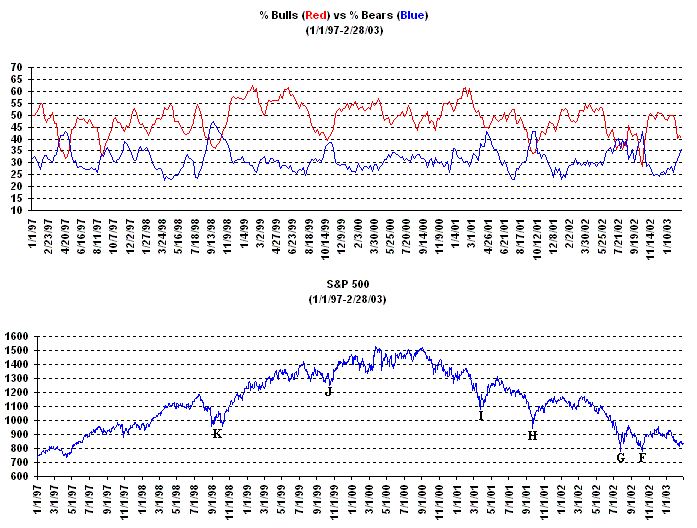
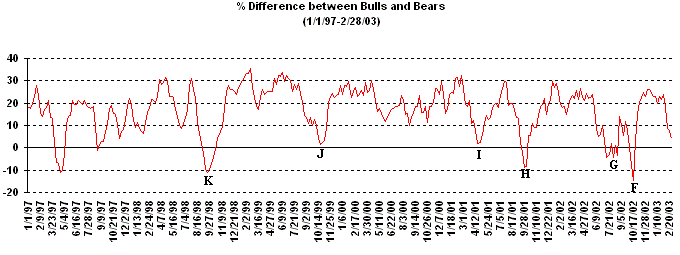
Finally the Bearish-Bullish Sentiment continues to show the % difference between the Bearish and Bullish Investment Advisors narrowing. In the past when the % of Bullish Investment Advisors has become equal to or less than the % of Bearish Advisors the market has typically made a bottom followed by a significant reversal to the upside (points F, G, H, I, J and K).
Based on the action in the Ten Year Bond this past week, the increasing amount of complacency as shown by the rapid drop in the Put to Call Ratio and the VIX still not showing any widespread panic yet among the investment community has me somewhat concerned that more selling pressure could eventually redevelop.
If you have enjoyed reading our Mid Week and Weekend Market Reports over the past three years we are asking for a small yearly donation to help pay for some of the costs to produce these free reports each week. This is strictly a volunteer request and doesn't mean you have to donate to keep receiving our free Mid Week and Weekend Market Reports each week. If you would like to Donate please click on the link below.
Each person who makes a Donation will also receive a "Free"
2 Week Trial Premium Membership
which includes our Daily Breakout Reports and Stocks to Watch list.
| ||||||