
Stock Market Analysis for the Dow, Nasdaq and S&P 500
(3/22/03)
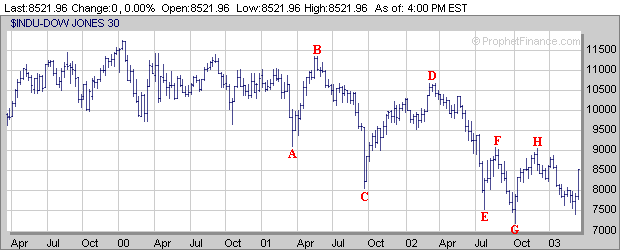
I'm sure many investors are wondering if this latest rally is the real deal or just another sharp Bear Market Rally which will eventually fizzle. Since 2001 there have been four explosive rallies (points A to B, C to D, E to F, and G to H) in the Dow but eventually they all failed. The question is will this time be different?
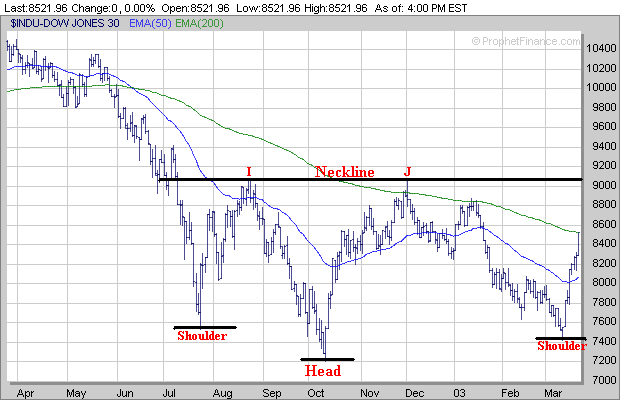
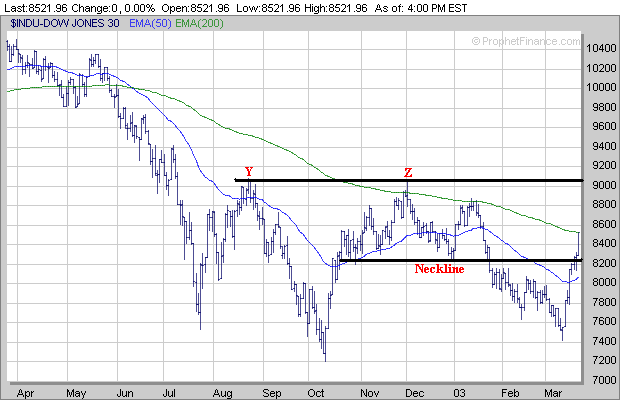
In my opinion there are a couple things to watch over the next several weeks. First the Dow may be developing an Inverted Head and Shoulders pattern and if it can rise above its Neckline near 9100 then that would be a bullish sign for the longer term. The 9100 level has been a major resistance area for the Dow since last Summer as it has stalled out near this level twice (points I and J) on previous rally attempts.
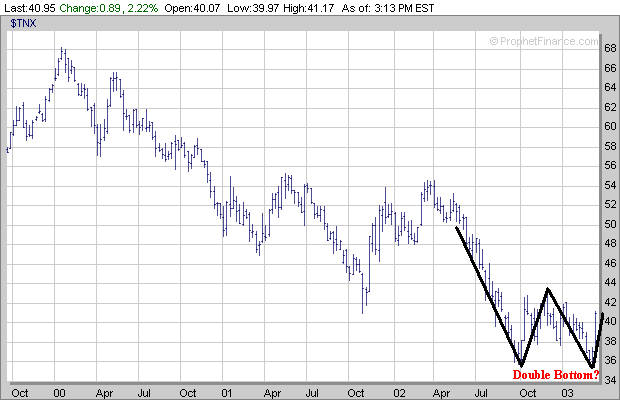
Meanwhile I'm also watching the Bonds as well which I mentioned last week could be developing a potential Double Bottom pattern (looks like the letter "W") as money flows out of Bonds and back into equities. If the TNX can break rise above the 44 level then this would be a Bullish sign for stocks in the longer term but a bad sign for those investors who have invested in Bonds.
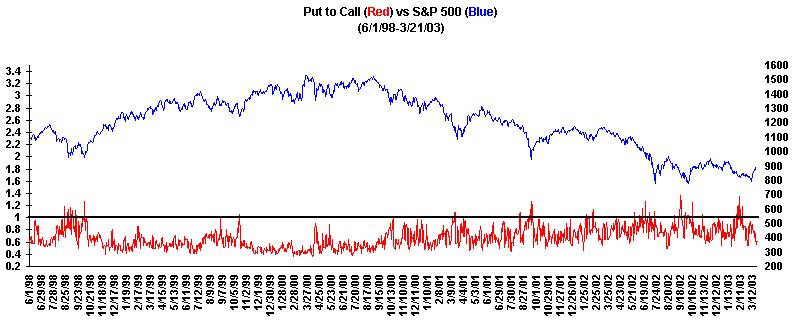
One thing that still bothers somewhat is the fact that the Contrarian Indicators really didn't show an extreme amount of pessimism as the market made a bottom on March 12th. Although the Put to Call Ratio did rise the previous week it remained below 1.0.
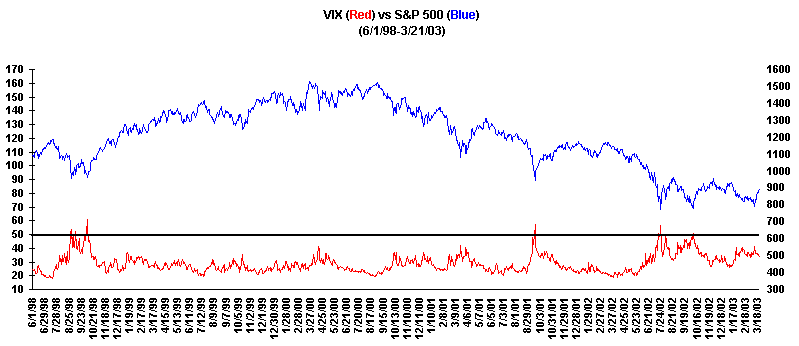
The Volatility Index (VIX) rose as the market made a bottom on March 12th however it didn't approach the 50 level which has signaled important market reversals in the past.
Finally the % difference between the Bullish and Bearish Investment Advisors did narrow over the past few months however the % of Bearish Investment Advisors (blue line) never exceeded the % of Bullish Investment Advisors (red line).
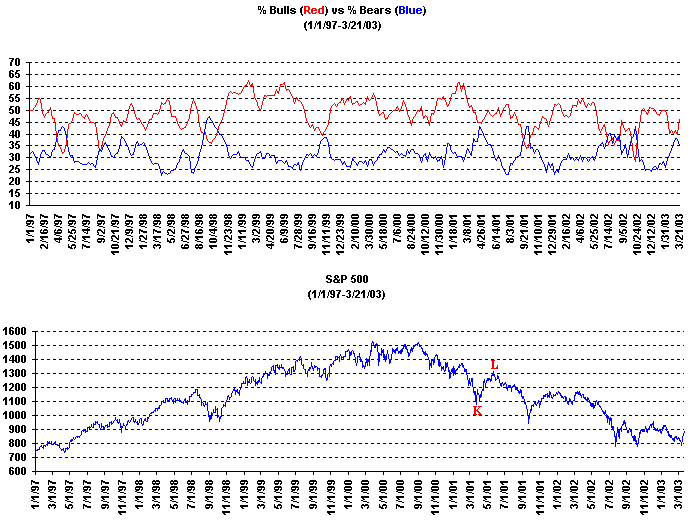
Overall the Contrarian Indicators are exhibiting similar characteristics that occurred in the Spring of 2001 when the S&P 500 rallied strongly for a few months (points K to L) and gained over 200 points before eventually stalling out and rolling over.
As far as the shorter term the major averages (Dow, Nasdaq and S&P 500) have become overbought and are due for some type of pullback. Remember the major averages never go straight up or down without having some type of pullback before resuming their trends.
Let us look at the Dow and go through some examples. Notice in the Summer of 2002 when the Dow rallied strongly from near 7500 to 9100 over a period of five weeks (points M to R) that it pulled back twice (points N to O and P to Q) before resuming its upward trend. Meanwhile this past Fall a similar pattern occurred as the Dow made a bottom and rallied from 7200 to near 9100 over a period of 2 1/2 months (points S to X). In this example the Dow also pulled back twice (points T to U and V to W) before resuming its upward trend.
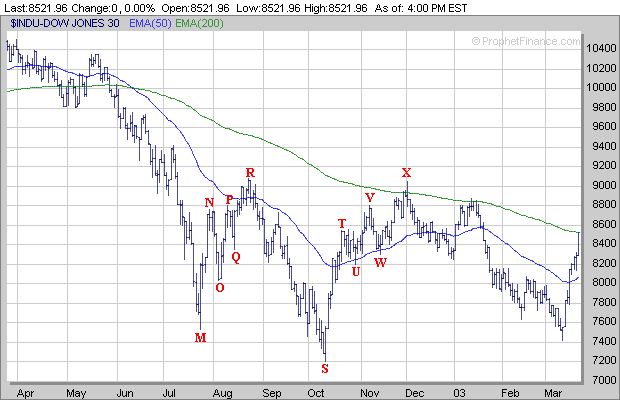
Currently the Dow has rallied over 1000 points since making a bottom on March 12th and has risen back to its 200 Day Exponential Moving Average (EMA) near 8530. As I mentioned above I would expect some type of pullback to develop in the near term before the Dow makes another leg higher. If a pullback does develop look for support at the Dow's Neckline in association with its previous Head and Shoulders Top pattern in the 8200-8250 range. In the longer term unless some catastrophic event occurs due to the war in Iraq it appears the Dow has a decent chance to rally back to its previous resistance area near 9100 which has impeded the Dow's upward advance twice during the past year (points Y and Z).
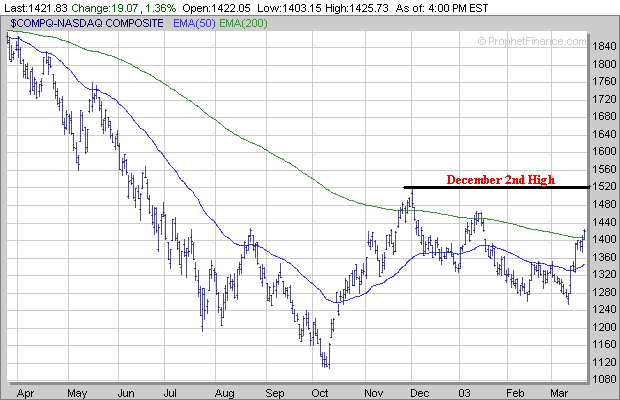
The Nasdaq has rallied over 170 points since making a bottom on March 12th and has now risen back above its 200 Day EMA (green line). If the Nasdaq begins to pullback for it to remain constructive it should remain at or above its 50 Day EMA (blue line) near 1350. In the longer term it appears there is a decent chance the Nasdaq may rally back to its December 2nd high near 1520 which would probably act as the next area of significant resistance to the upside.
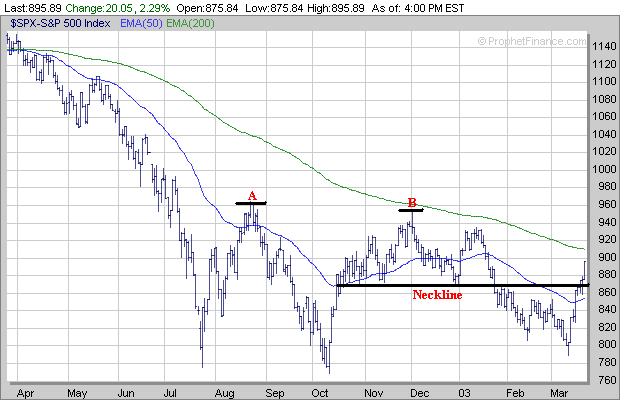
The S&P 500 has rallied around 100 points since making a bottom on March 12th and is about 15 points away from its 200 Day EMA (green line). If a pullback develops in the S&P 500 I would look for support at its Neckline in association with its previous Head and Shoulders Top pattern near 870. In the longer term if the S&P 500 can break above its 200 Day EMA near 910 then there is a good chance it will rally up to the 955-965 (points A and B) which is where it has encountered significant resistance during the past year.
Unless some significant terrorist attack occurs or the war with Iraq begins to bog down I would imagine that we are in the beginning stages of some type of multi-week rally. Now this doesn't mean the major averages will be up every week as there will likely be some choppy periods with at least two separate pullbacks as shown by the examples of the Dow above.
As an investor you should start finding those stocks which are breaking out of a favorable chart pattern ("Cup and Handle", "Double Bottom" and "Flat Base") accompanied by strong volume which are providing leadership as those will be the ones that perform the best.
If you don't have the time to scan through thousands of charts we provide a list of "Stocks to Watch" based on those stocks which are exhibiting a favorable chart pattern.
| ||||||