
Weekend Market Analysis
(3/8/03)
It continues to be a rather volatile market environment and it seems like every piece of news related to Iraq or Terrorism are causing overreactions in either direction.
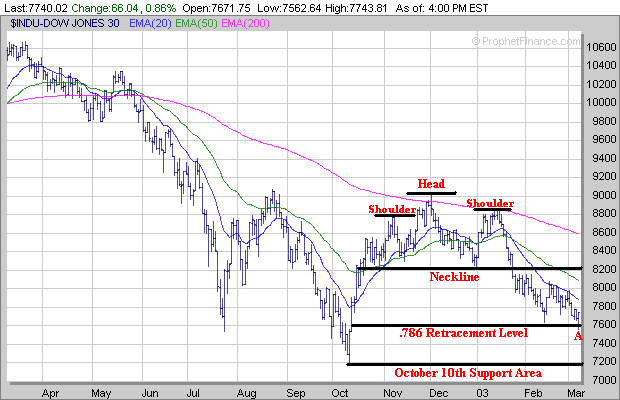
The Dow broke below its .786 Retracement Level (calculated from the October 10th low to the December 2nd high) on Friday near 7600 (point A) but then rallied to close above it by the end of the day. If a short term bounce develops next week look for initial resistance at the Dow's 20 Day Exponential Moving Average (EMA) near 7900 as the Dow hasn't been able to trade above its 20 Day EMA (blue line) since mid February. Meanwhile if the Dow breaks below the 7600 level and continues lower then the next major support area would be the October 10th low near 7200.
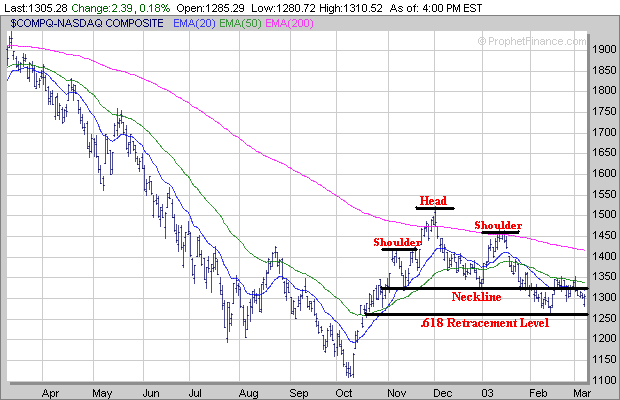
The Nasdaq has been able to hold support so far at its .618 Retracment Level (calculated from the October 10th low to the December 2nd high) near 1260. If the Nasdaq tries to bounce next week I would look for initial resistance at its Neckline associated with its Head and Shoulders Top pattern near 1325. If the Nasdaq can rally above its Neckline then look for stronger resistance in the 1340 (50 Day EMA) to 1350 area. Meanwhile as mentioned above the key support level to watch in the Nasdaq is around the 1260 level if it trends lower.
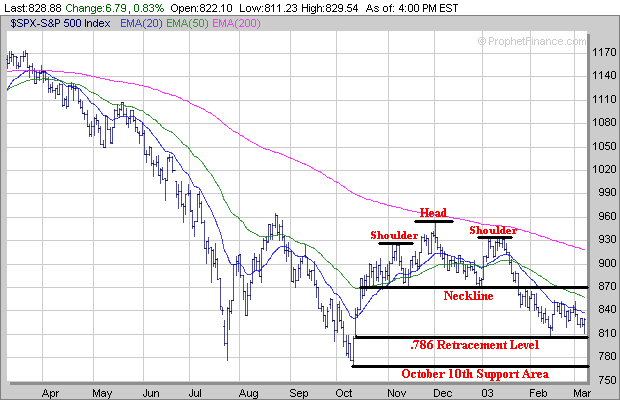
The S&P 500 has been able to hold support near its .786 Retracement Level (calculated from the October 10th low to the December 2nd high) near 805. However just like the Dow it has been having a difficult time staying above its 20 Day EMA (blue line) since mid February as well. Thus if the S&P 500 does try and mount some type of rally next week look for initial resistance near its 20 Day EMA around 840 with even stronger resistance at its 50 Day EMA (green line) near 860. Meanwhile if the S&P 500 is unable to hold support near the 805 level then its next major support area would be the October 10th low near 770.
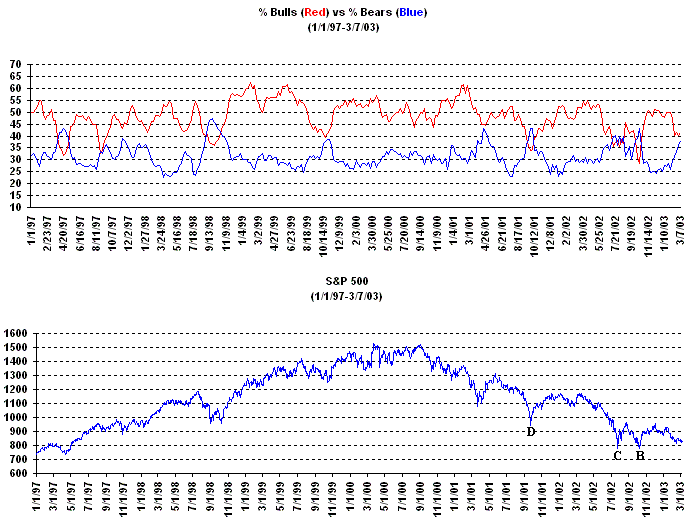
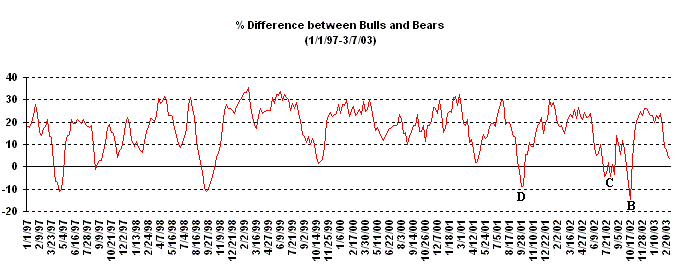
As for the Contrarian Indicators there continues to be some positive developments in the Bullish-Bearish Sentiment as the % difference between the two is still narrowing. However the % of Bullish Investment Advisors (red line) is still greater than the % of Bearish Investment Advisors (blue line). What I would like to see is for the % of Bearish Investment Advisors to become greater than the % of Bullish Investment Advisors as this has generally led to some significant market reversals over the past few years (points B, C and D).
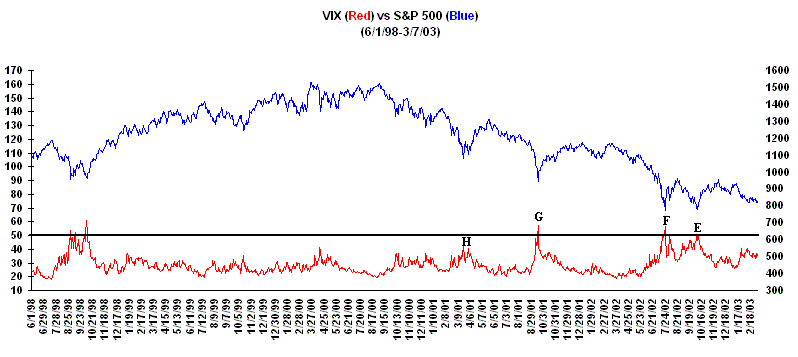
Meanwhile I'm still somewhat bothered by the rather low reading in the Volatility Index (VIX) which has had a difficult time rising above the 40 level over the past two months. In a perfect world what we would like to see is for the VIX to break well above the 40 level and approach or exceed 50 which has led to some significant market reversals over the past two years (points E, F and G). However the VIX doesn't necessarily always have to rise to the 50 level to signal a significant market reversal which occurred in the Spring of 2001 (point H).
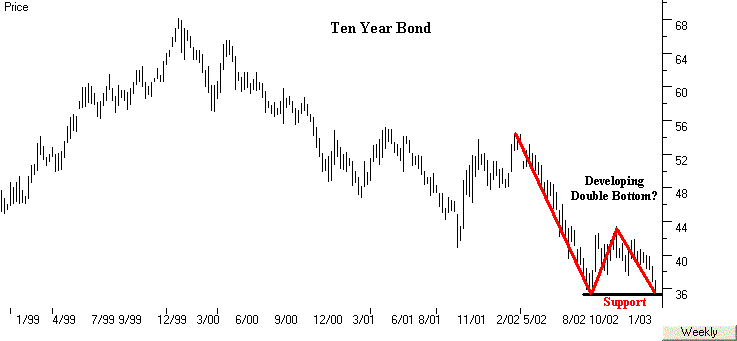
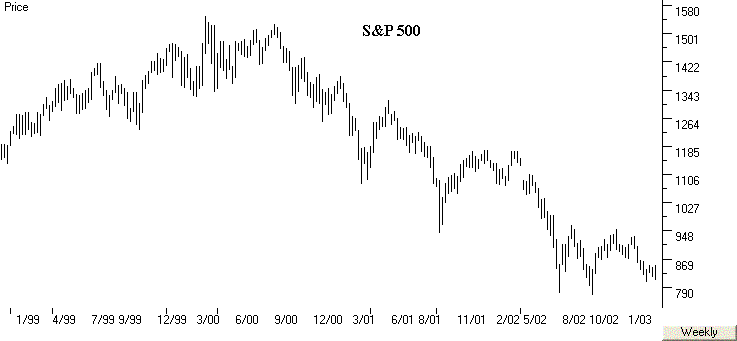
Another thing to watch is the action in the Bonds as over the past four years the major averages have generally followed their trend. Two charts comparing the Ten Year Bond (TNX) to the S&P 500 are shown below which show how the two of them have pretty much trended in the same direction over the past four years. There are a few things to watch in the TNX. First it's going to be interesting to see if the TNX can hold support in the 35.50 to 35.75 range which is near the October 2002 low. If the TNX can hold support near its October 2002 low then this could lead to the development of a Double Bottom pattern (looks like the letter "W") which could eventually lead to a bottom in the major averages followed by a significant rally. Thus watch the TNX closely over the next week or two and see if it can hold support near the October 2002 low as this could be significant.
If you have enjoyed reading our Mid Week and Weekend Market Reports over the past three years we are asking for a small yearly donation to help pay for some of the costs to produce these free reports each week. This is strictly a volunteer request and doesn't mean you have to donate to keep receiving our free Mid Week and Weekend Market Reports each week. If you would like to Donate please click on the link below.
Each person who makes a Donation will also receive a "Free"
2 Week Trial Premium Membership
which includes our Daily Breakout Reports and Stocks to Watch list.
| ||||||