
Stock Market Analysis for the Dow, Nasdaq and S&P 500
(4/19/03)
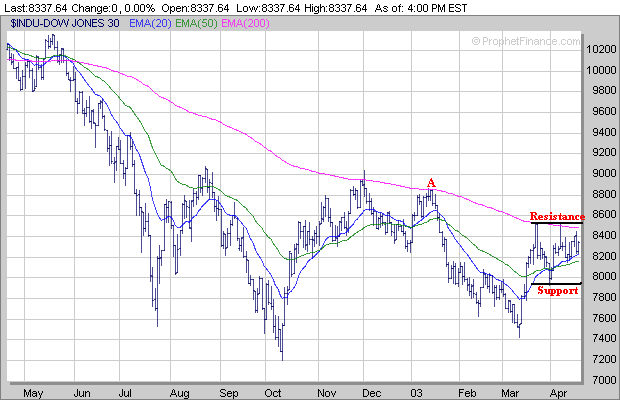
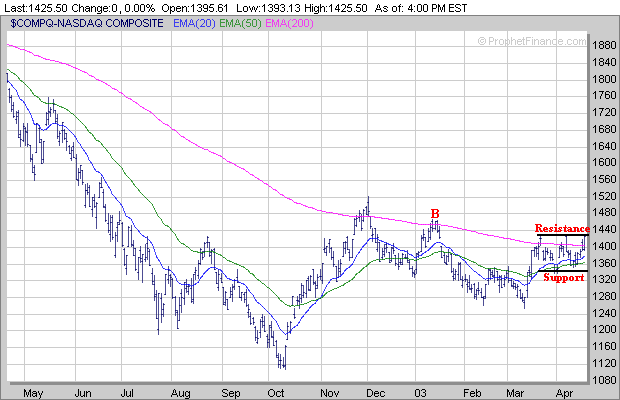
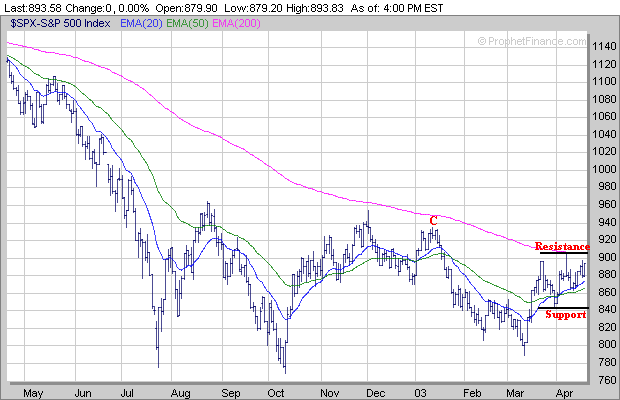
Once again the major averages are beginning to approach the top of their trading ranges which have been in place since mid March.
The Dow is having the most difficult time so far as it still remains about 200 points away from the top of its trading range near 8520 which is also near to its 200 Day Exponential Moving Average (EMA). If the Dow can break above the top of its trading range near 8520 then the next area of upside resistance is the mid January high near 8850 (point A). Meanwhile if the Dow begins to falter look for initial support at its 50 Day EMA (green line) near 8150. If the Dow drops below its 50 Day EMA then the next area of support would be the March 31st low near 7930.
The Nasdaq is back near the top of its trading range in the 1425-1430 area which is where it has stalled out twice before. If the Nasdaq can break above this resistance next week then the next area of upside resistance in the near term would be the mid January high near 1460 (point B). Meanwhile if the Nasdaq stalls out again near the 1430 area and begins to pull back look for support in the 1360 (50 Day EMA) to 1370 (20 Day EMA) range..
The S&P 500 has remained in a trading range between 843 and 905 since mid March and is about 11 points away from the top of its trading range which is also near its 200 Day EMA. If the S&P 500 can break above the 905 level then the next area of upside resistance is the mid January high near 935 (point C). Meanwhile if the S&P 500 is unable to break above the top of its trading range and begins to falter look for initial support in the 865 (50 Day EMA) to 875 (20 Day EMA) range.
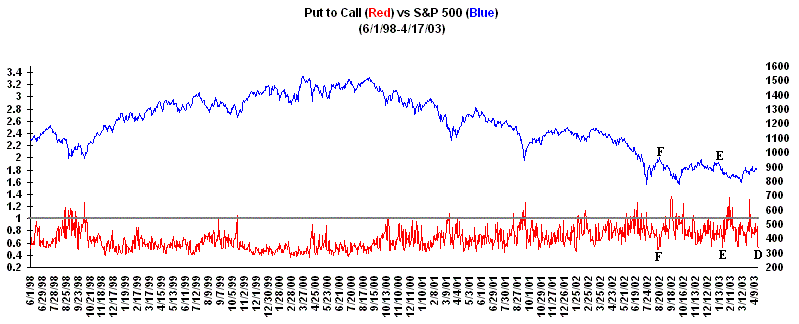
Despite all of the bullish talk by some analysts lately I believe what is currently occurring in the Contrarian Indicators shouldn't be ignored. The Put to Call Ratio dropped significantly (point D) this past week and sometimes this can lead to a market reversal such as what happened in mid January (point E) and last Summer (point F).
Meanwhile the Volatility Index (VIX) also continues to drop and is only about 4 points away from reaching the 20 level which in the past has signaled a nearing top and reversal to the downside (points G, H, I, J, L and M). Maybe the VIX will be wrong this time put over the past 5 years it has been fairly reliable.
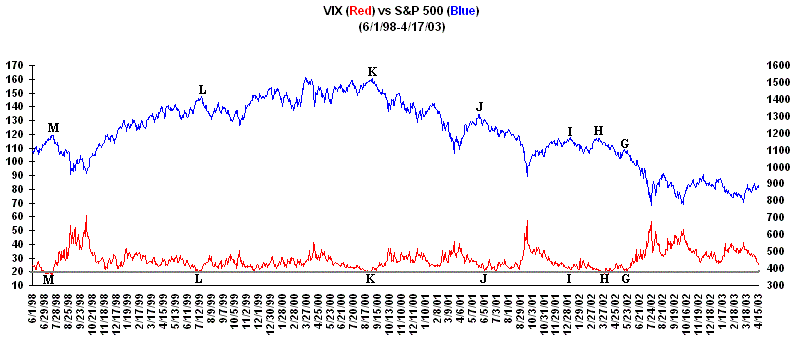
With both the Put to Call Ratio and VIX now trending strongly in the same direction this is a signal that investors are becoming increasingly complacent which could eventually lead to some selling pressure.
Finally continue to look for those stocks which are forming a favorable chart pattern such as the "Cup and Handle". NFLX is a good example of a stock which exhibited a "Cup and Handle" pattern before breaking out in mid March. NFLX formed a 7 month Cup from late July of 2002 until late February of 2003 and then developed a 3 week Handle (H) before breaking out accompanied by increasing volume in mid March (point N).
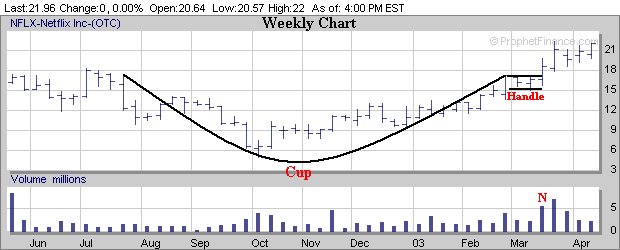
This is just one type of favorable chart pattern to look for when deciding which stocks to invest in. If you are finding it difficult or don't have the time to scan through all of the stocks in the market we provide a "Stocks to Watch List" which gives investors a quick way to see which stocks are developing the best looking chart patterns. If you would like access to our current "Stocks to Watch List" you can signup for a Free 2 Week Trial Membership by clicking on the link below.
Click here to Signup for a "Free" 2 Week Premium Trial Membership to amateur-investor.net
| ||||||