Stock Market Analysis for the Dow, Nasdaq and S&P 500
(4/26/03)
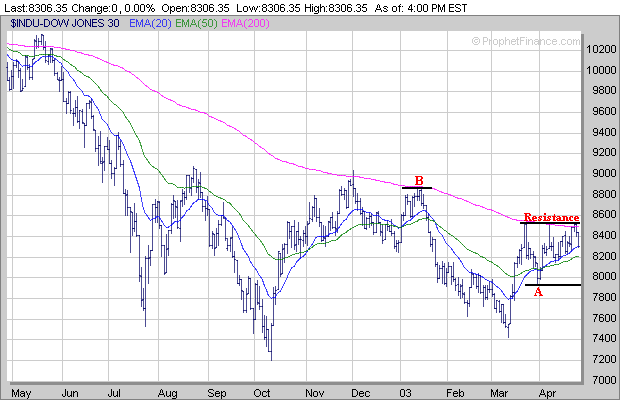
The Dow ran into resistance for the third time since mid March near its 200 Day EMA (purple line) around the 8520 level this past week and then began to pullback. If the Dow continues lower the next area of support would be at its 50 Day EMA (green line) near 8200. The Dow really needs to hold support near its 50 Day EMA to remain constructive for the short term. If it doesn't then it could drop back to its March 31st low near 7930 (point A). Meanwhile if the Dow eventually resumes its upward trend from the mid March low and can break above its 200 Day EMA then the next area of upside resistance would be the mid January high near 8850 (point B).

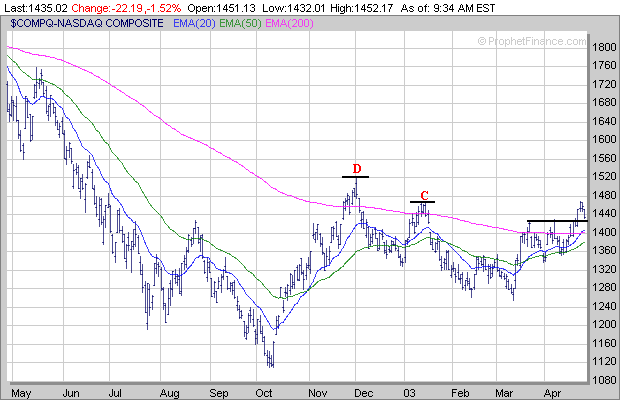
The Nasdaq ran into resistance last week near its mid Janaury high around the 1470 level (point C) and then began to pullback. If the Nasdaq fails to hold support near the top of its prior trading range in the 1425-1430 area then the next support level would be near the intersection of its 20 Day EMA (blue line) and 200 Day EMA (purple line) near 1400. If the Nasdaq drops below the 1400 level then the next area of support would be at its 50 Day EMA (green line) near 1380. Meanwhile if the Nasdaq eventually resumes its upward trend from the mid March low and breaks above the 1470 level the next area of upside resistance would be the early December 2002 high near 1520 (point D).

The S&P 500 finally broke above its 200 Day EMA (purple line) last week which it hasn't been able to do for over a year however it began to pullback on Thursday and Friday. If the S&P 500 continues lower look for initial support either at its 20 Day EMA (blue line) around 885 or near its 50 Day EMA (green line) near 875. Meanwhile in the longer term if the S&P 500 eventually resumes its upward trend which started from the mid March low look for upside resistance near its mid January high around 935 (point E) or at its early December 2002 high near 955 (point F).

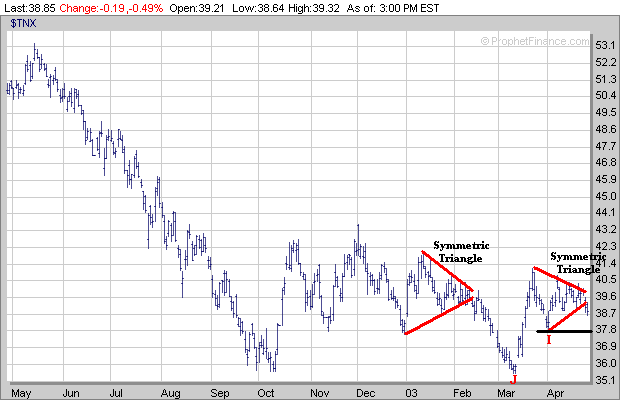
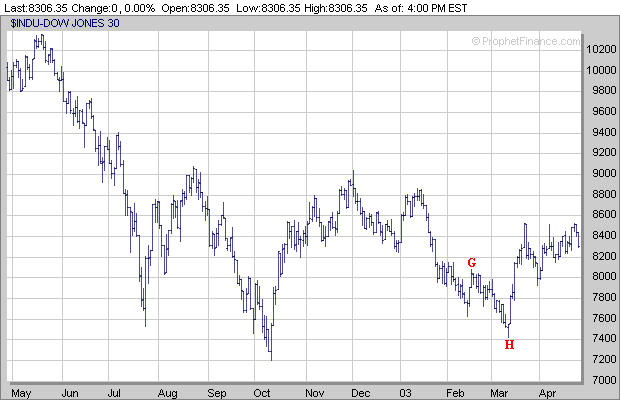
Meanwhile watch the Ten Year Bond (TNX) over the next week or two for any further signs of money flowing back into Bonds and out of equities. I noticed this past week the TNX has formed another Symmetrical Triangle pattern similar to what occurred in February before the TNX made a significant move to the downside as money flowed strongly back into Bonds which eventually led to a sell off in the Dow (points G to H) in which it dropped nearly 700 points over a three week period. The key level to watch in the TNX is around the 37.75 area (point I). If the TNX drops below this level then it will likely retest its mid March low near 35.50 (point J).


| ||||||