Stock Market Analysis for the Dow, Nasdaq and S&P 500
(4/12/03)
Over the past few weeks there has been an increasing amount of bullishness and complacency developing in the market as revealed by the Bullish-Bearish Sentiment readings and the Volatility Index (VIX). The % difference difference between the Bullish (red line) and Bearish (blue line) Investment Advisors has steadily increased since the major averages made a bottom on March 12th.
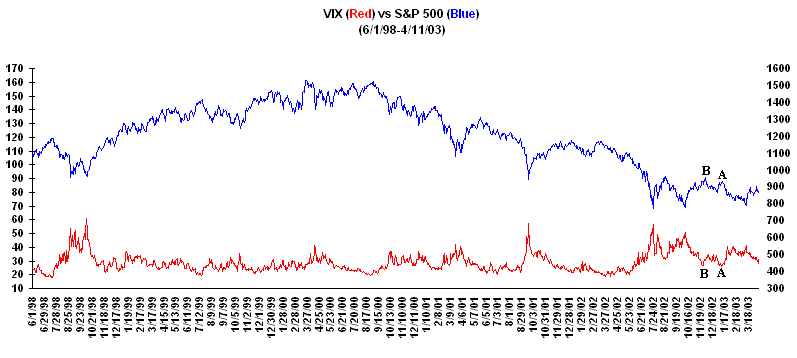
Meanwhile the VIX has begun to decrease as well and is approaching a value in the mid 20's which signaled a nearing sell off twice before over the past 6 months (points A and B).

Thus it will be important to watch these two psychological market indicators over the next few weeks for any further rise in the % difference between the Bullish and Bearish Investment Advisors or drop in the VIX which could signal an increasing chance of a more substantial sell off down the road.
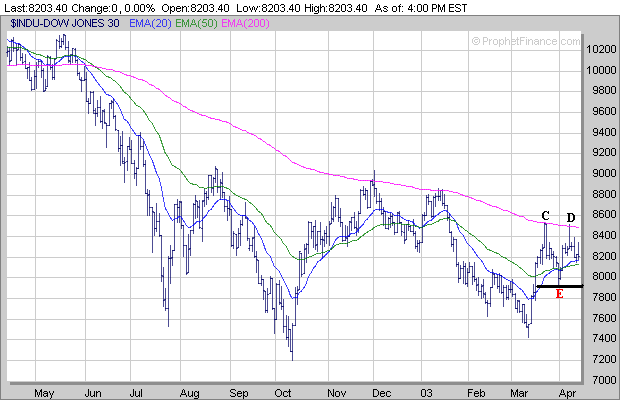
As for the major averages over the past three weeks the Dow has encountered resistance twice near its 200 Day EMA (purple line) just above 8500 (points C and D). This past week the Dow came under some selling pressure but so far has held support just above its 50 Day EMA (green line) near 8120. In the near term it appears the Dow will either try and rally back to its 200 Day EMA near 8500 or it will fail to hold support near its 50 Day EMA and retest its March 31st low near 7930 (point E).

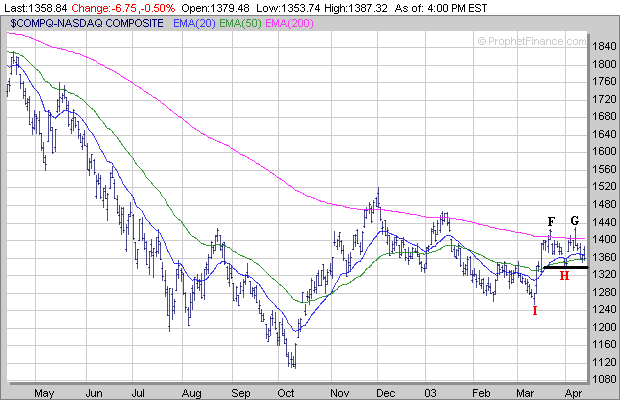
The Nasdaq has encountered resistance twice over the past three weeks just above its 200 Day EMA (purple line) in the 1425 to 1430 range (points F and G) but has been able to find support near its March 31st low near 1337 (point H). In the near term if the Nasdaq begins to rally once again look for resistance in the 1425-1430 range. Meanwhile if the Nasdaq fails to hold support near 1337 then this could eventually lead to a retest of of the March 12th low near 1253 (point H).

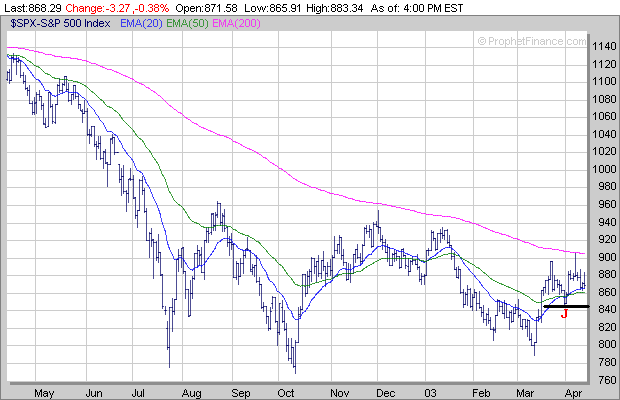
The S&P 500 stalled out near its 200 Day EMA (purple line) early last week near 908 and began to sell off but did hold support above its 50 Day EMA (green line) near 860. If the S&P 500 tries to rally in the near term once again look for resistance near its 200 Day EMA. Meanwhile if the S&P 500 breaks below its 50 Day EMA then a drop back to its March 31st low near 843 (point J) is likely.

| ||||||