
Stock Market Analysis for the Dow, Nasdaq and S&P 500
(5/10/03)
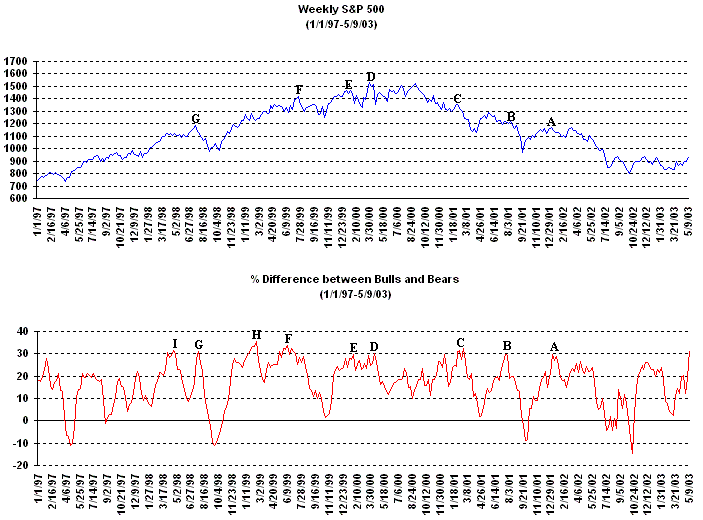
So far the major averages have held up despite the excessive amount of bullishness and complacency which has quickly redeveloped. The % difference between the Bullish and Bearish Investment Advisors has increased rapidly over the past few weeks and now has exceeded the 30% level for the first time since the Winter of 2001. If we go back and look and what has happened when the % difference between the Bullish and Bearish Investment Advisors has approached or exceeded the 30% level since 1998 in several cases this eventually signaled a nearing sell off (points A, B, C, D, E, F and G).
Now there have been a few cases prior to the development of the Bear Market in early 2000 when the % difference between the Bullish and Bearish Investment Advisors exceeded 30% and the market didn't sell off and was able to move higher such as in the Winter of 1999 (point H) and in the Spring of 1998 (point I). However if you play the percentages only 2 out of 9 times (22%) has the market been able to move higher when the % difference between the Bullish and bearish Investment Advisors has risen to 30% or more while 78% of the time it has led to some type of sell off since 1998.
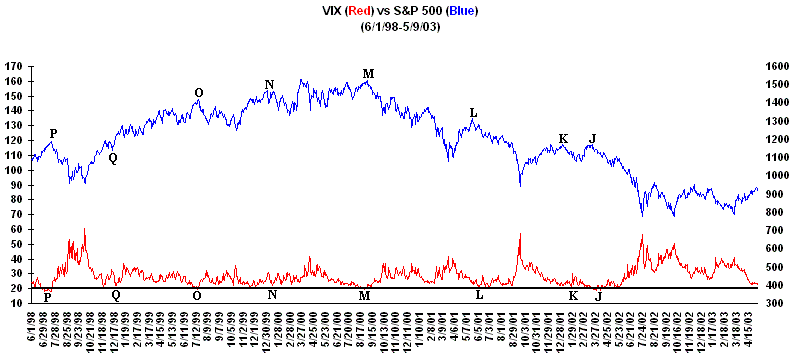
Meanwhile the Volatility Index (VIX) is starting to drop again and is only a few points away from the 20 level (solid black line) which has signaled a nearing sell off several times in the past since 1998 (points J, K, L, M, N, O and P). Now there was one case when the VIX approached the 20 level and the market only had a minor sell off before heading higher which occurred in the Winter of 1998 (point Q). Thus if you go with the percentages the odds of the market rallying strongly when the VIX drops at or below 20 has been rather low (1 out of 9 or 11%) while the chances of of a sell off is 89% since 1998.
Hopefully the Contrarian Indicators will be wrong this time and we will see a repeat of what occurred in the Winter of 1999 although the odds would tell us that some type of sell off may be approaching.
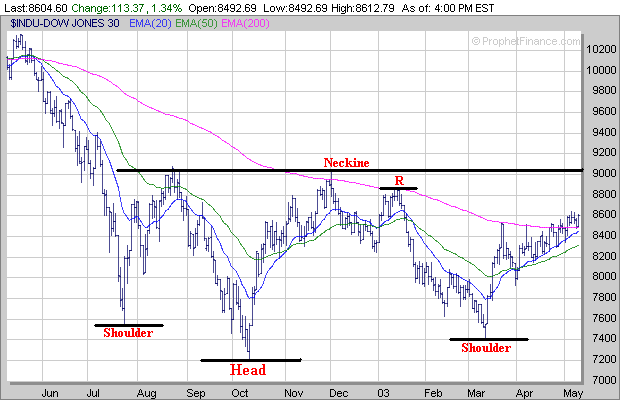
As far as the major averages the Dow was able to hold support this past week at it 200 Day EMA (purple line) near 8500. There are two upside resistance areas to watch in the Dow if it decides to move higher. The first is at the mid January high around 8850 (point R) and a second more important one just above 9000 which is the Neckline associated with the longer term Inverted Head and Shoulders pattern.
Meanwhile if the Dow does begin to come under more selling pressure and is unable to hold support at its 200 Day EMA then look for support either at its 20 Day EMA (blue line) near 8425 or at its 50 Day EMA (green line) around 8300.
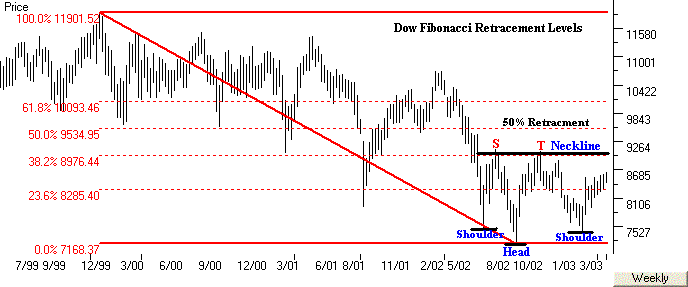
In the longer term if the Dow can break solidly above its Neckline in association with its Inverted Head and Shoulders you can look at the longer term Fibonacci Retracement Levels to get some idea of the Dow's longer term upside potential. Notice how in the two previous rally attempts that occurred in the Spring of 2002 and Fall of 2002 that the Dow stalled out just above its 38.2% Retracement Level (calculated from the Winter 2000 high to the early Fall 2002 low) near 9000 ( points S and T) which by coincidence is also near the Neckline!!
Now if the Dow can find a way break above the 9000 level its next two areas of upside resistance would be at its 50% and 61.8% Fibonacci Retracement Levels which are near 9500 and 10000 respectively.
The Nasdaq continues well above its 50 Day EMA (green line) and 200 Day EMA (purple line) and has performed the best since making a bottom in mid March. From my perspective the Nasdaq has completed the right side of a 5 month Cup and now needs to settle down and develop a constructive Handle over the next few weeks before making another significant move higher. If the Nasdaq begins to surge upward without developing a basing pattern over the next few weeks I believe this could lead to a significant sell off shortly thereafter which would hinder its longer term potential.
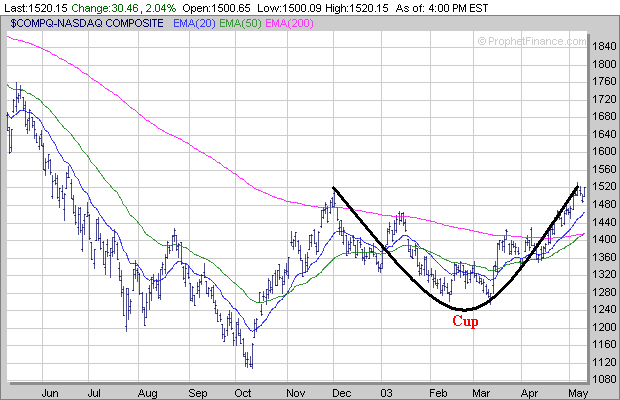
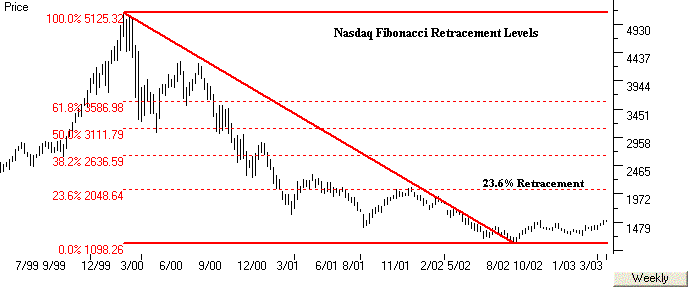
Now if the Nasdaq can develop a constructive "Handle" over the next few weeks before making another significant move higher the question is where could it go to. Once again if we look at the longer term Fibonacci Retracement Levels (calculated from the early 2000 high to the Fall 2002 low) so far the Nasdaq hasn't even come close to its 23.6% Retracement Level which is around 2050. If the Nasdaq can form a Handle over the next few weeks and then breakout to the upside it appears the next major area of longer term resistance would be around 2050.
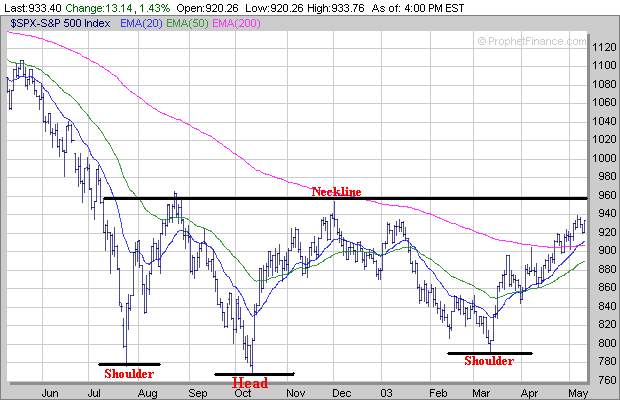
The S&P 500 has remained above its 200 Day EMA (purple line) and 50 Day EMA (green line) and its next significant upside resistance area is around 960 which is acting as the Neckline in association with its longer term Inverted Head and Shoulders pattern.
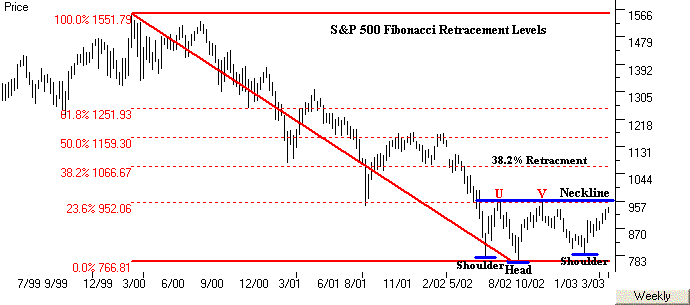
Meanwhile if we look at the longer term Fibonacci Retracement Levels (calculated from the early 2000 high to the Fall 2002 low) the S&P 500 has stalled out twice near its 23.6% Fibonacci Retracement (points U and V) which is also near the Neckline as well. Now if the S&P 500 can break above the 960 resistance area it appears the next major area of upside resistance would be at the 38.2% Fibonacci Retracement level near 1067.
The question is can the major averages rally strongly in the weeks ahead, despite the Contrarian Indicators indicating an excessive amount of Bullishness and Complacency among the investment crowd, similar to what occurred in the early part of 1999 or will there be an eventual sell off instead? No matter what transpires it should be interesting over the next several weeks.
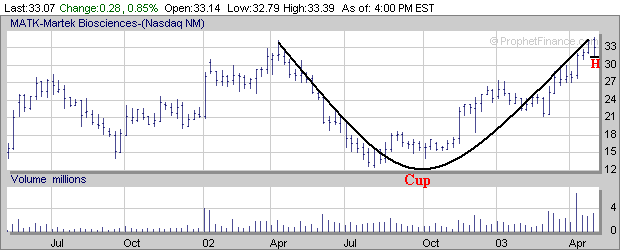
Over the next few weeks we will continue to follow the developments in MATK which was our Focus Stock of the Month for May. So far MATK has been holding up well after forming the right side of a Cup and appears to be in the beginning stages of developing a Handle (H). What we want to see over the next few weeks is for MATK to trade sideways and continue to work on its Handle before making another move higher.
| ||||||