
Stock Market Analysis for the Dow, Nasdaq and S&P 500
(5/17/03)
The major averages have basically been in a steady up trend since mid March with the Nasdaq leading the way with a gain of nearly 24% since then while the S&P 500 has rallied 20% and the Dow 18.5%.
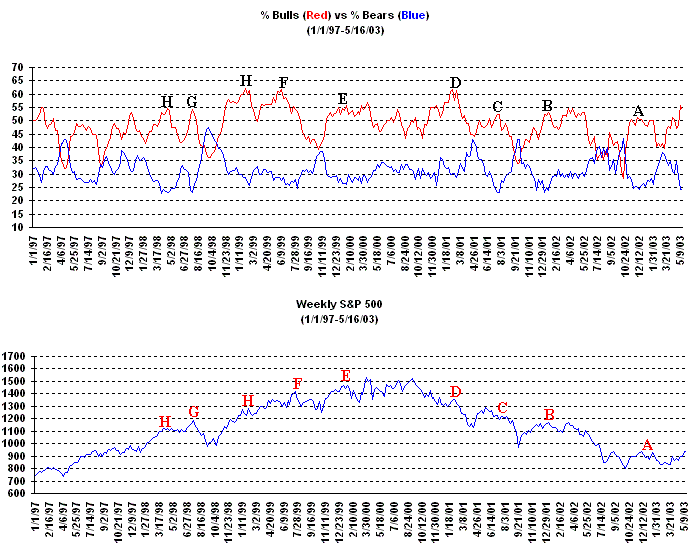
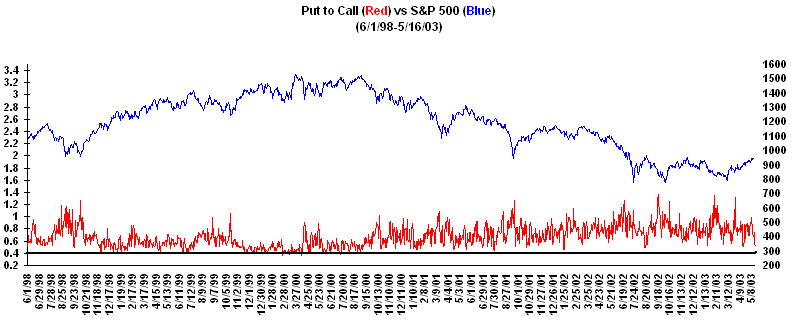
Over the past few weeks there has been a continued rise in the amount of Bullishness and Complacency as shown by the three Contrarian Indicators I watch (Bullish-Bearish Sentiment, Put to Call Ratio and the Volatility Index (VIX)). The Bullish-Bearish Sentiment shows a large % difference has developed between the Bearish and Bullish Investment Advisors as the market has rallied. I noticed in Investors Business Daily (IBD) this past week that they said this indicator only works for market bottoms and not market tops. I disagree with this statement as there have been several times when the % difference between the Bearish and Bullish Investment Advisors has risen to 30% or more and signaled a nearing pullback/sell off. Some examples include earlier this year (point A), from late 2001 into early 2002 (point B), early Summer of 2001 (point C), the early part of 2001 (point D), the early part of 2000 (point E), Summer of 1999 (point F) and the Summer of 1998 (point G). However as I pointed out last weekend there was a few occurrences (points H) when the % difference between the Bearish and Bullish Investment Advisors was large and only led to a minor pullback before the market head higher which was in the early part of 1999 and in the Spring of 1998. As the examples below show even when the market was controlled by the Bulls in 1998 and 1999 there were still instances when a large % difference between the Bearish and Bullish Investment Advisors signaled a nearing pullback/sell off before the market could make another significant move upward so I don't believe you can simply ignore this fact.
Meanwhile this past week the Put to Ratio which had been increasing as the market moved higher began to drop sharply by the end of the week.
In addition the Volatility Index (VIX) also continued to drop this past week and is now nearing the 20 level which has signaled a nearing pullback/sell off in the past on several occasions (points I). Now the once exception to this was back in early 1999 (point J) when the VIX was near 20 but the market only suffered a minor pullback before heading higher.
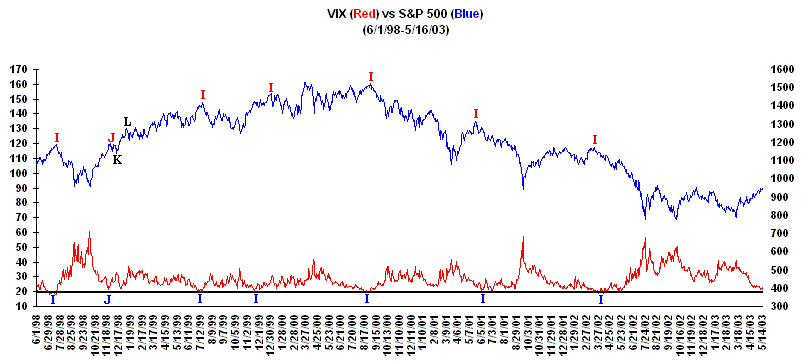
At this point based on past history the odds would favor some type of pullback/sell off developing before much longer. Now this can either be a constructive pullback like occurred in the early part of 1999 in which the S&P 500 only dropped about 5% (points J to K) before making another strong move higher (points K to L) or it can turn into something more significant.
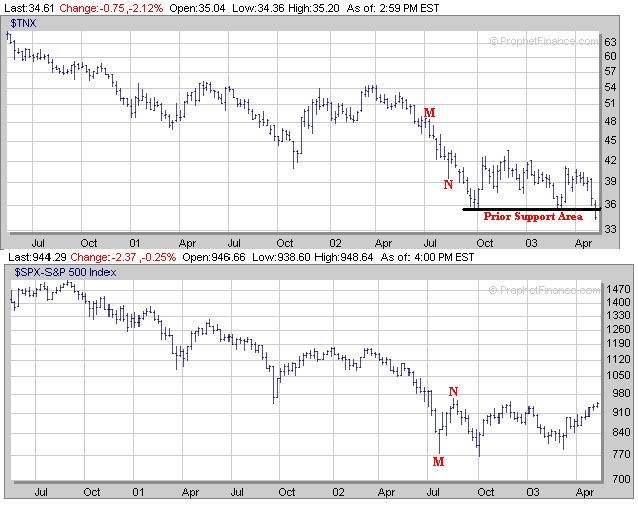
Another interesting development has been in the Ten Year Bond (TNX) over the past week as a key level was breached around the 3.55% level. Over the past three years strength in Bonds has usually been detrimental to Equities but so far there has been a divergence between the two as Equities have been able to rally despite money also flowing into Bonds. A similar pattern also occurred in the Summer of 2002 when Equities rallied (points M to N) despite strength in the Bonds. I don't think this divergence can last much longer and something is going to have to give as I don't think money can continue to flow into both Bonds and Equities for an extended period of time.
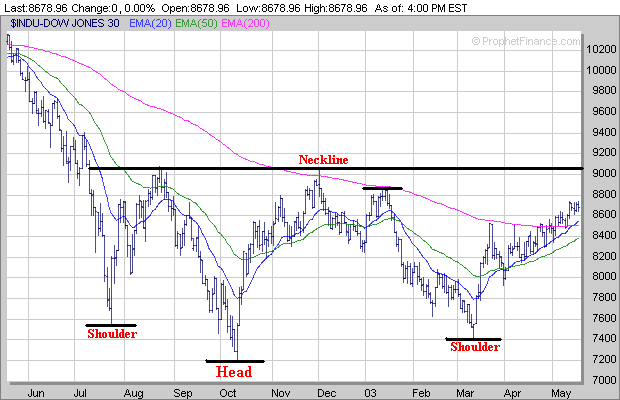
As far as the major averages both the Dow and S&P 500 still haven't been able to rally up to their prior longer term resistance areas which exist at their Necklines in association with Inverted Head and Shoulder patterns. Also keep in mind the Dow's longer term 38.2% Fibonacci Retracement Level (calculated from the early 2000 high to the October 2002 low) is also close to the 9000 level as well. This past week the Dow basically traded sideways after gapping up on Monday but still is above its 200 Day EMA (purple line) which will be a key support area to watch if a pullback develops. Once again expect strong resistance near the 9000 level if the Dow continues higher from its current level next week..
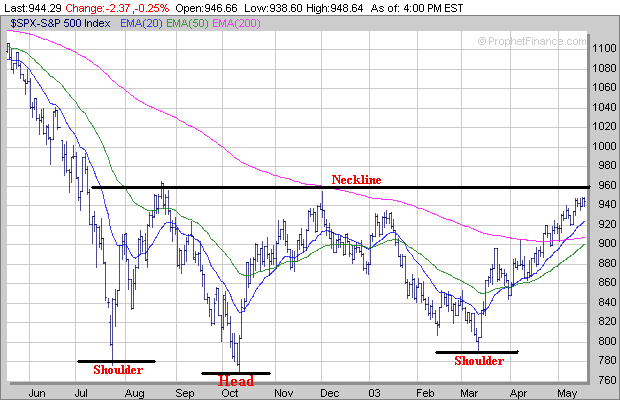
The S&P 500 also has significant resistance near 960 which as mentioned above is near the Neckline and also coincides with its longer term 23.6% Fibonacci Retracement Level (calculated from the early 2000 high to the October 2002 low). The S&P 500 also traded sideways much of the week and remains above its 20 Day EMA (blue line) which should provide short term support if a pullback does develop. If the S&P 500 continues higher next week from its current level look for strong resistance around 960.
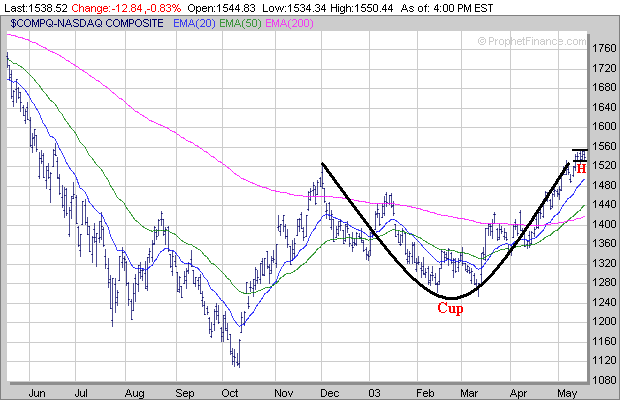
Finally the Nasdaq which has been performing the best and is well above all of its Exponential Moving Averages (EMA) may be starting to develop a very small Handle (H) after forming a 5 month Cup. I believe the best thing for the Nasdaq in the longer term would be for it to remain in a trading range over the next few weeks and hold support above its 20 Day EMA (blue line) while continuing to work on its Handle. However if the Nasdaq just continues higher next week without forming much of a Handle I think this could be detrimental for the longer term.
To sum everything up I believe the best thing that could happen over the next few weeks would be for the market to pullback some on diminishing volume similar to what occurred in early 1999 before the market made another significant move higher. I still have my concerns with the amount of Bullishness and Complacency that has developed based on the Contrarian Indicators but hopefully this will only lead to a minor pullback like occurred in the early part of 1999.
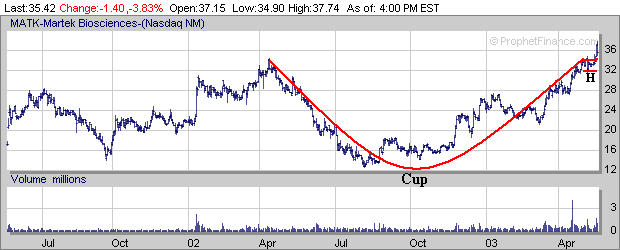
Meanwhile our Stock of the Month for May (MATK) tried to break out of a small 2 week Handle (H) this past week on Thursday but reversed strongly on Friday instead. Personally I would have liked to have seen MATK develop a longer Handle before breaking out. It has been my experience that stocks which develop very small Handles (less than a few weeks) before breaking out more times than not will usually end up failing to follow through in the longer run so we shall see what happens with MATK. Also this is why it's always important to have a Stop Loss Strategy in place just in case a breakout attempt fails to follow through as not every stock that attempts to break out of a favorable chart pattern is going to be successful.
| ||||||