
Stock Market Analysis for the Dow, Nasdaq and S&P 500
(5/24/03)
Despite the big down day on Monday the major averages were able to stabilize by mid week and held up well through Friday. Once again there continues to be an excessive amount of Bullishness and Complacency in the market and the question remains can the stock market make another significant move higher despite what the Contrarian Indicators are showing. It's possible one of two scenario's could occur during the next several weeks.
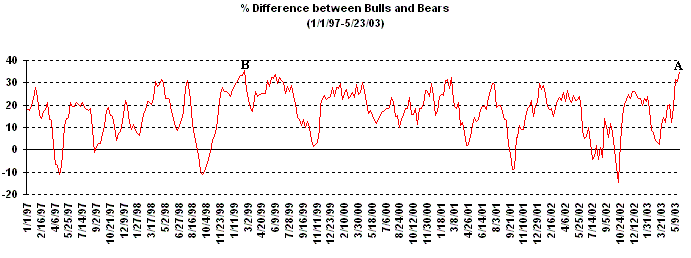
First let us look at a potential Bullish scenario for the stock market. Currently there is a large % difference between the Bullish and Bearish Investment Advisors which has now exceeded 35% (point A). There was one case during the past 6 years when the % difference between the Bullish and Bearish Advisors exceeded 35% back in 1999 (point B) but the stock market didn't sell off severely and eventually was able to make another significant move upward.
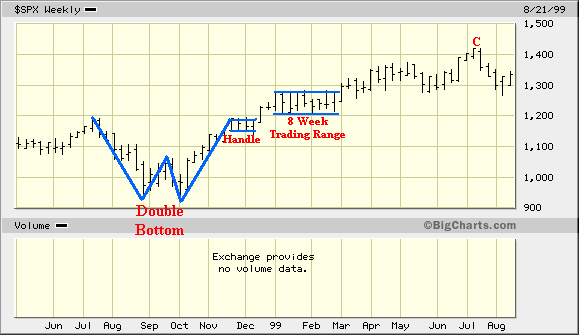
If we at an analysis of the S&P 500 from late 1998 through 1999 notice that it initially broke out of a favorable Double Bottom and Handle pattern in early December of 1998 and rallied abut 100 points before peaking around 1280 which was about the same time the % difference between the Bullish and Bearish Investment Advisors rose to around 35% as shown above. Meanwhile during the next 8 weeks the S&P 500 basically traded sideways with a trading range between 1210 and 1280 before eventually breaking out in early March. This led to a choppy rally over the next 4 months before the S&P 500 peaked in early July of 1999 near 1420 (point C). During that 4 month period the S&P 500 rallied nearly 11%. In this case the extreme level of Bullishness didn't lead to a large sell off in the market and was followed by a consolidation period that lasted around 8 weeks before the market headed higher.
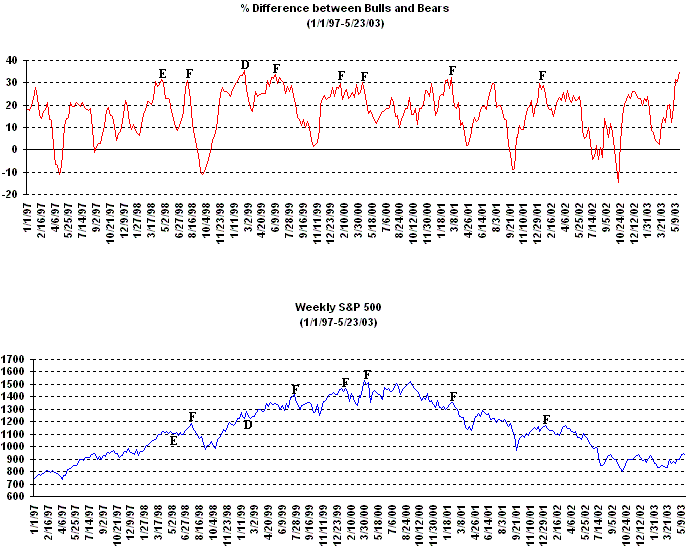
Now let us look at the potential Bearish scenario. In the past a large % difference between the Bullish and Bearish Investment Advisors has more times than not led to an eventual pullback/sell off (points F) except in early 1999 (point D) and further back in the early Summer of 1998 (E).
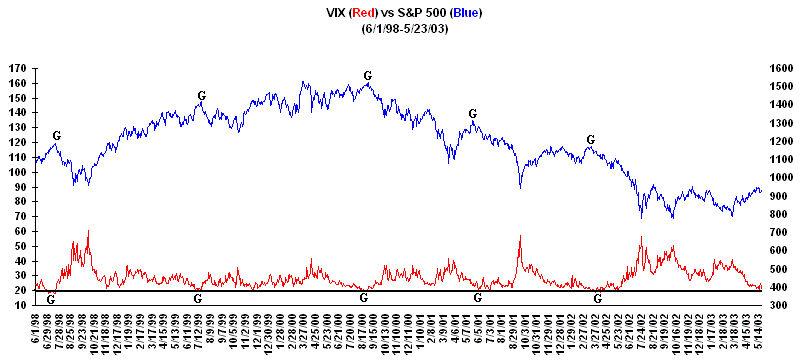
In addition when the VIX has reached an extreme level to the downside (around 20) this has also signaled a nearing pullback/sell off on several occasions denoted by the letter (G). Currently the VIX is still very low and is hovering in the lower 20s.
It looks like the best thing that could happen to the stock market averages would be for them to develop trading ranges over the next few weeks before attempting to move higher similar to what occurred in the early part of 1999. However if the major averages don't trade sideways and rise on diminishing volume I think that could eventually lead to a more substantial pullback/sell off similar to what has happened before when the VIX has been around the 20 level.
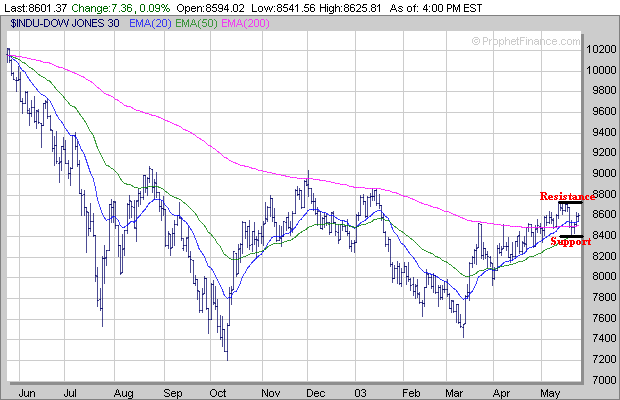
Moving on to the major averages the an analysis of the Dow shows it held support this past week just above its 50 Day Exponential Moving Average (EMA) near 8400. As I mentioned above I now would like to see the Dow develop some type of multi-week trading range between its mid May high near 8750 (resistance area) and its 50 Day EMA near 8400 (support area) before attempting to make another substantial move higher.
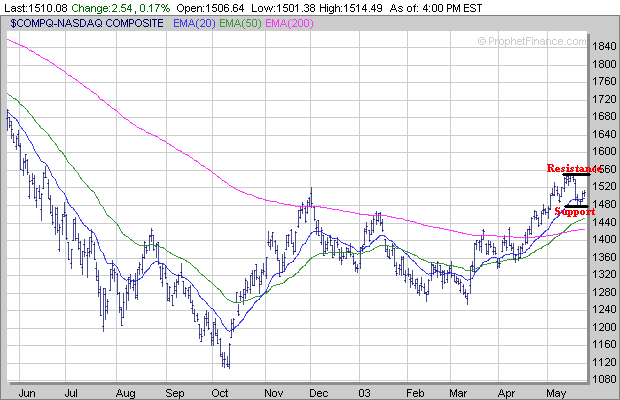
As for the Nasdaq I would also like to see it develop a multi-week trading range between its mid May high near 1550 (resistance area) and the low made last week near 1480 (support area) before making another significant move higher.
The S&P 500 found support this past week near its 200 Day EMA (purple line) around 910. Just like the Dow and Nasdaq I would like to see the S&P 500 now develop a multi-week trading range between its mid May high near 950 and the low made last week near 910.

Meanwhile as I looked at several charts on Friday I noticed two things. First those stocks which broke out in mid March in tandem with the major stock averages averages are now getting over extended in price and secondly many stocks which have formed the right side of a favorable "Cup" pattern now need to develop constructive Handles over the next several weeks before heading higher. Thus lends further support to the notion that it would be more constructive for the market to consolidate for a period of time before attempting to move higher.
Finally SNDK is a good example of why there is too much bullishness in the stock market as investors aren't being patient enough to allow a stock to develop a proper Handle (H). SNDK formed a nice 5 1/2 month Cup from December through mid May but only developed a Handle for 3 days before breaking out on Wednesday. This chart looks very similar to ARTI which did the same thing just a few weeks ago and eventually sold off after a few days. Will SNDK suffer the same fate as ARTI next week?
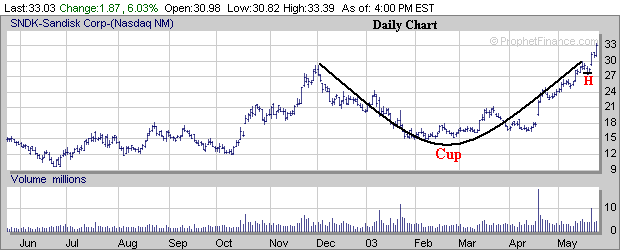
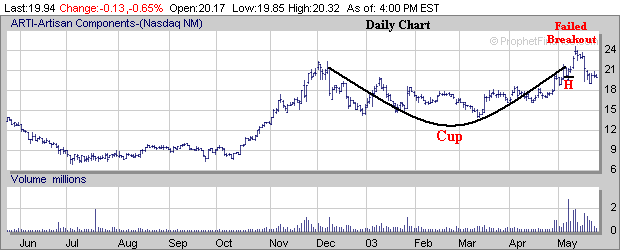
When you are looking for stocks to invest in make sure they have developed a proper Handle after forming a Cup. Those stocks which develop a Handle for a period of 4 weeks or more have a much better chance of succeeding for the longer term versus those that only develop a Handle for a few days. BLTI provides an example of a stock which developed an 8 week Handle before breaking out in mid March accompanied by strong volume (point I).
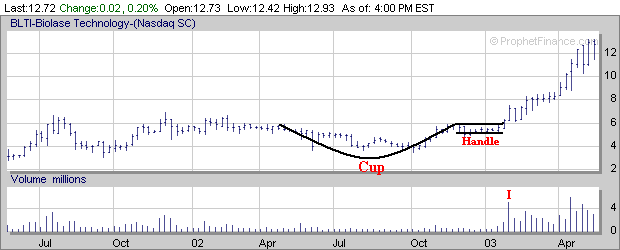
Now this doesn't mean every stock which develops a Handle for 4 weeks or more will do as well as BLTI did but the chances for a significant return are usually much better than a stock which only develops a Handle for a week or less.
| ||||||