
Stock Market Analysis for the Dow, Nasdaq and S&P 500
(5/31/03)
The Institutional Money did a good job of rallying the market into month end so it will be interesting to see if they will be so generous as we move into the month of June. The Nasdaq and the S&P 500 have been the strongest since mid March with gains of 27.2% and 22.2% respectively while the Dow has been lagging behind at 19.6%.
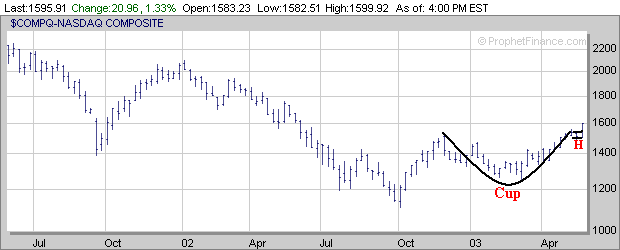
The Nasdaq is attempting to break out of a 5 month Cup and small 2 week Handle (H) pattern. It has been my experience over the past several years that an index or a stock which only forms a Handle for a week or two before breaking out has a higher chance of failing to follow through than those which develop a Handle for a longer period of time (4 weeks or more) before breaking out. Thus it will be interesting to see if the Nasdaq will follow through on this breakout attempt or fail within a week or two.
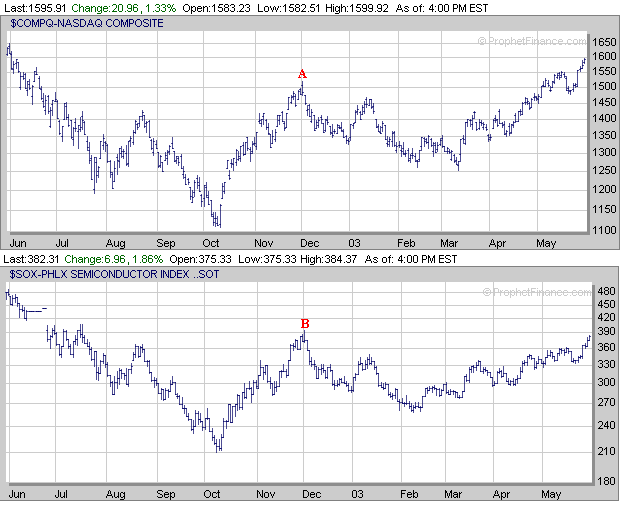
Meanwhile I'm also keeping my on the Semiconductor Index (SOX) as it usually goes hand in hand with the Nasdaq as shown by the charts below. One thing to notice is that although the Nasdaq has now risen above its early December 2002 high near 1520 (point A) the SOX still hasn't cleared its early December high near 395 (point B) yet. Thus this could be an area where the SOX may encounter some potential resistance that could lead to some type of pullback which may affect the Nasdaq as well so this will be something to watch for next week.
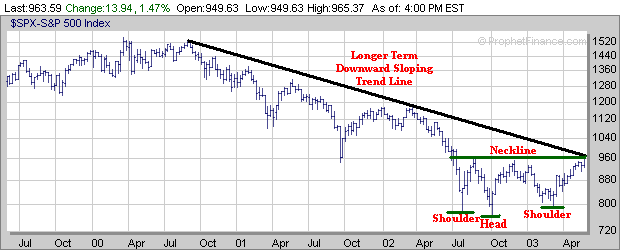
The S&P 500 has risen back to its Neckline in association with its Inverted Head and Shoulders pattern which is also where its longer term downward sloping trend line (black line) comes into play in the 960-965 area.
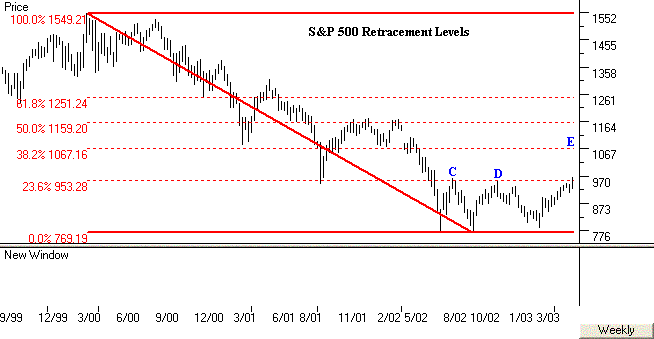
Furthermore the S&P 500 has risen just above its 23.6% Retracement Level from the March 2000 high to the October 2002 low which is where it has stalled out twice before (points C & D). Will the S&P 500 stall for a third time near its longer term 23.6% Retracement Level or will it eventually break strongly above it this time around? If the S&P 500 can break strongly above the 965 level it appears the next significant area of resistance would be at its longer term 38.2% Retracement Level near 1067 (point E).
As for the Dow it still hasn't been able to rally back to its Neckline in association with its Inverted Head and Shoulders pattern which is just above the 9000 level.
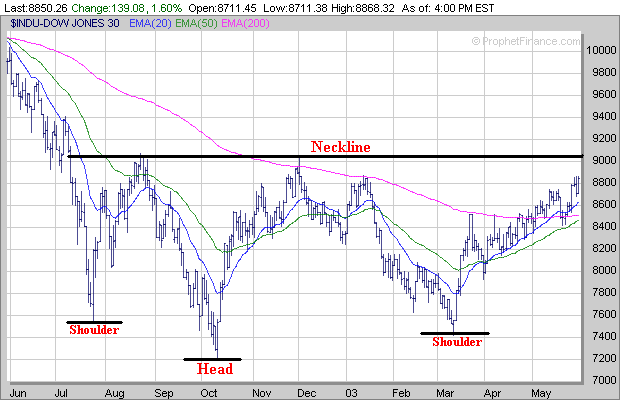
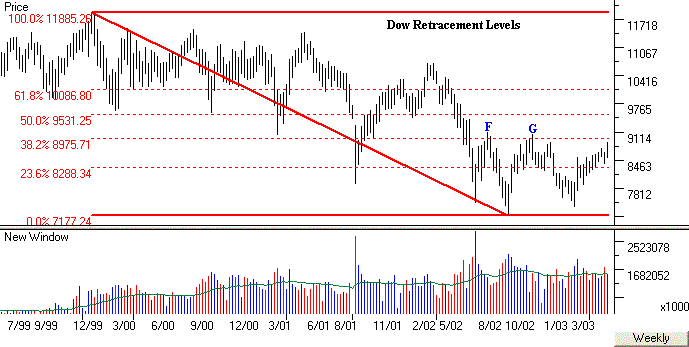
In addition the Dow has encountered resistance twice before just above its longer term 38.2% Retracement Level near the 9000 level (points F & G) as well. Thus the Dow may encounter strong resistance once again as it approaches the 9000 level.
The Contrarian Indicators haven't changed much from the prior week as there is still an excessive amount of Bullishness and Complacency which so far hasn't affected the market yet. The % difference between the Bullish and Bearish Investment Advisors remains quite high and is still near a 6 year high.
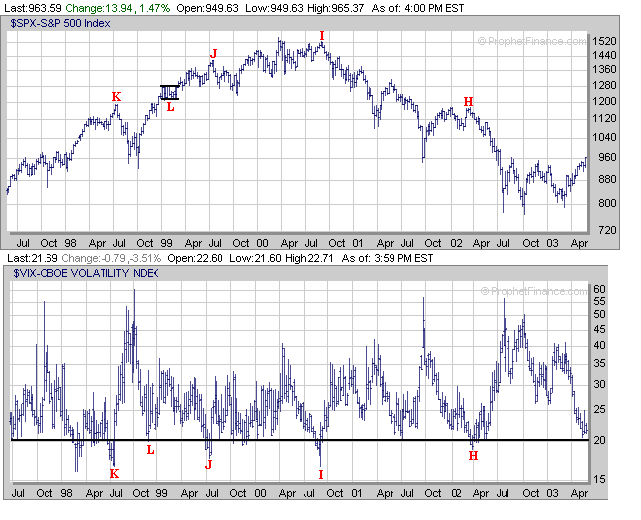
Meanwhile the Volatility Index (VIX) continues at a very low level but still hasn't dropped below the critical threshold value of 20 which has signaled market reversals in the past (points H, I, J and K). As I have pointed out before maybe this time the VIX will be wrong and the market won't under go a substantial correction similar to what occurred in the early part of 1999 when the S&P 500 basically traded sideways and consolidated for 8 weeks (points L) before eventually moving higher.
The major averages have been in a steady up trend for nearly 12 weeks and are getting rather overbought. At some point we are going to see some type of consolidation/retracement develop which I believe is probably going to happen at some point during the month of June. An index just like a strong performing stock doesn't go up forever without going through a consolidation/pullback phase before resuming its upward trend.
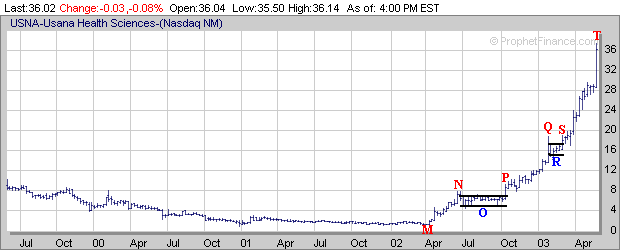
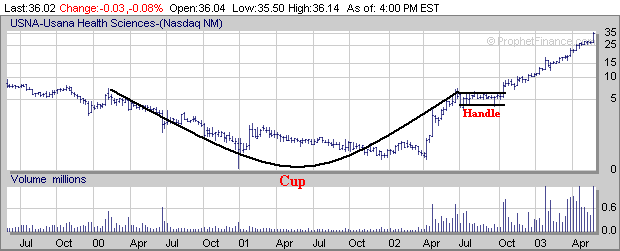
USNA provides a good example of how a strong performing stock will go through consolidation stages as it maintains its upward trend. Notice how USNA made an 11 week run from early April until the latter half of June in 2002 (points M to N) and then traded sideways and consolidated for 16 weeks (point O) before going through another extended run (16 weeks) from October of 2002 until the latter half of January in 2003 (points P to Q). USNA then consolidated again for a period of 4 weeks (point R) before making another substantial run (13 weeks) beginning in early March which continued through last week (points S to T). Over the past year USNA has appreciated nearly 1700% and has been one of the best performing stocks in the market. USNA initially caught my eye in August of 2002 as it was completing a favorable Cup and Handle pattern and was mentioned as one to watch in our Weekend Analysis published on August 24, 2002.
| ||||||