
Stock Market Analysis for the Dow, Nasdaq and S&P 500
(6/14/03)
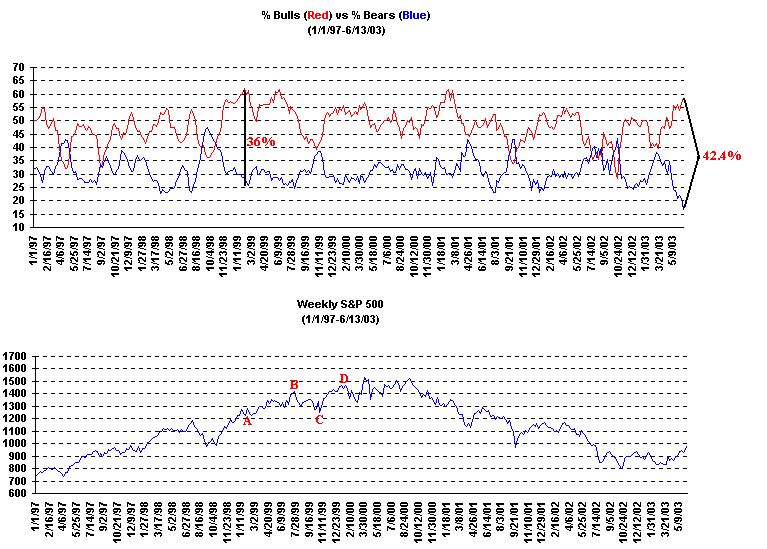
So far the major averages have held up despite the extreme level of Bullishness and Complacency that now exist in the market. The % difference between the Bullish and Bearish Investment Advisors now stands at 42.4% which is the largest % difference between the two since April of 1987. With this extreme amount of Bullishness now present in the market it's hard to imagine that some type of multi week correction isn't going to occur before much longer.
Now this correction can end up going two possible ways. The best case scenario would be for something similar to what occurred in the early part of 1999 when the major averages basically traded sideways for 8 weeks (point A) before heading higher as the % difference between the Bullish and Bearish Investment Advisors reached an extreme level around 36%. On the other hand the worst case scenario would be for a prolonged sell off to occur lasting several weeks similar to what transpired in the late Summer and early Fall of 1999 (points B to C) although the market was still able to rally strongly after it bottomed in October of 1999 (points C to D).
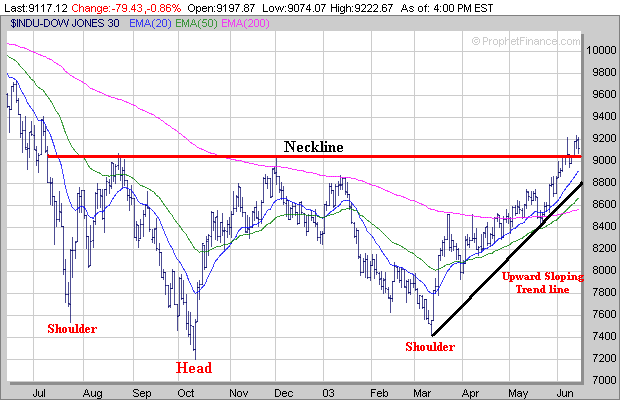
If some type of correction does take place there are some key support levels to watch in the major averages. So far the Dow has remained above its Neckline (red line) in association with its previous Inverted Head and Shoulders pattern. If the Dow drops below its Neckline the first key level to watch would be near 8800 as this is where the Dow's upward sloping tend line (black line) originating from the March low comes into play. Also as I pointed out last weekend the 23.6% Retracement Level calculated from the March low to the Dow's most recent high is near 8800 as well. Thus the 8800 area appears to be a key support area to watch if a correction does develop.
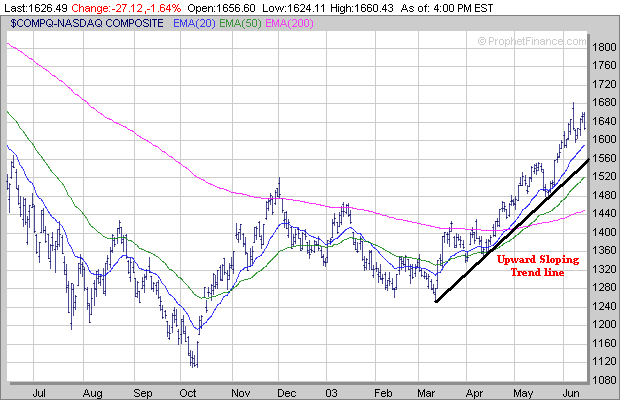
As for the Nasdaq the areas to watch for possible support if a correction develops is between 1560 (upward sloping trend line originating from the March low) and 1590 (20 Day Exponential Moving Average). In addition the 23.6% Retracement Level calculated from the March low to the high made on June 6th is near 1582. Thus the 1560-1590 range appears to be a key area to watch for support in the Nasdaq.
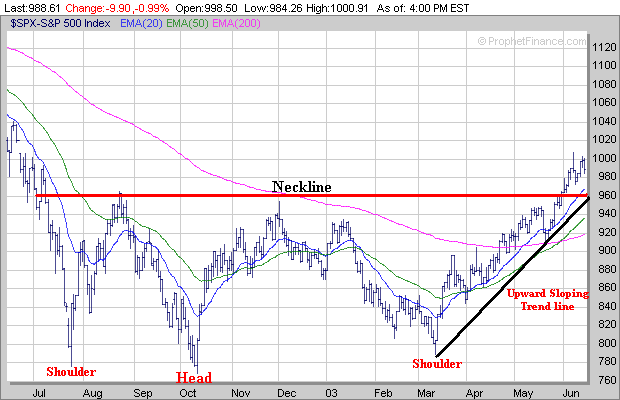
Meanwhile if a correction develops in the S&P 500 the 960 area appears to be a significant support area as three separate things come together near this level. First the Neckline associated with the S&P 500's Inverted Head and Shoulders pattern is around 960. Secondly the S&P 500's upward sloping trend line originating from the March low also comes into play near 960 and thirdly the 23.6% Retracement Level calculated from the March low to the high made on June 6th is at 956. If the S&P 500 does enter a correction phase the 960 area appears to be the first key support area to watch.
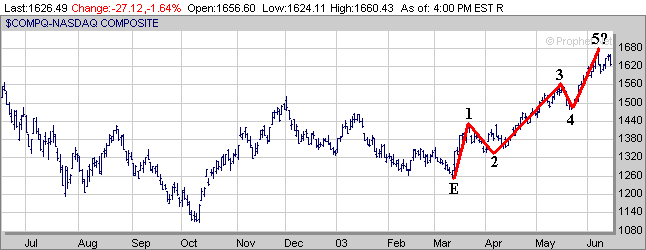
Last weekend I talked about Elliot Wave Theory and mentioned that it looked like in the short term the Nasdaq may have completed a 5 Wave pattern with 3 separate upward moves (E to 1, 2 to 3 and 4 to 5) and 2 separate downward moves (1 to 2 and 3 to 4) after making a bottom in March (point E).
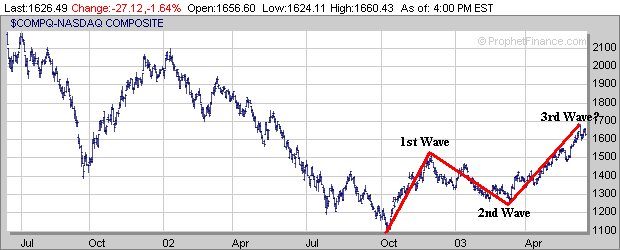
Although some type of correction is likely to develop before much longer it appears from a longer term perspective that the Nasdaq has just completed the 3rd Wave of a potential longer term Elliot 5 Wave pattern. Notice how the 1st Wave (upward move) was associated with the rally from the October 2002 low to the early December 2002 high. This was then followed by the 2nd Wave (downward move) as the Nasdaq corrected from December of 2002 until the low was made in March of 2003. Meanwhile the potential 3rd Wave (upward move) began in March and was completed on June 6th. If you believe in Elliot Wave Theory then the 4th Wave should be another downward move followed by the 5th Wave (upward move) which would complete the Elliot 5 Wave pattern sometime late this year or in the early part of 2004.
Finally when you are looking for stocks to invest in a lot of times you may miss the 1st breakout attempt unless you watch the market on a daily basis. However the strongest performing stocks will always give you a 2nd opportunity to get into them if you monitor them closely.
For example TRAD which has appreciated over 400% since early March first broke out of a 4 week Handle (H) in early March after forming a Cup and went from $2.00 to $6.75 over the next 9 weeks.
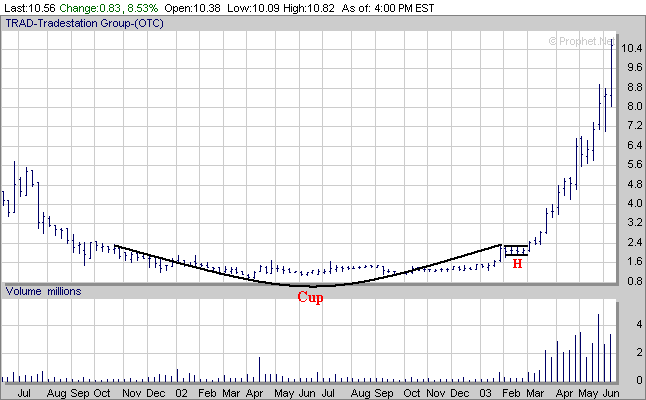
TRAD then formed another Cup and Handle pattern and broke out of its 3 week Handle (H) in mid May and has risen from $6.50 to $10.50 over the past 4 weeks.
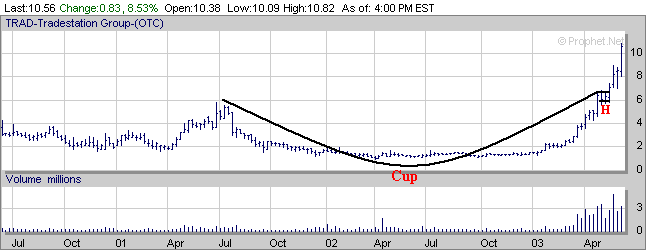
Thus even if you had missed the 1st breakout in early March there still was an opportunity to catch the 2nd move in mid May.
| ||||||