
Stock Market Analysis for the Dow, Nasdaq and S&P 500
(6/21/03)
The next two weeks are going to be interesting due to month end and also since it will be the end of the 2nd Quarter for the Institutional Money Managers as well. In addition there is a Federal Reserve Meeting which has been getting a lot of press about the prospects of an interest rate cut by 50 basis points. The question is can the major averages make one more rally attempt before going through a multi week consolidation/pullback phase.
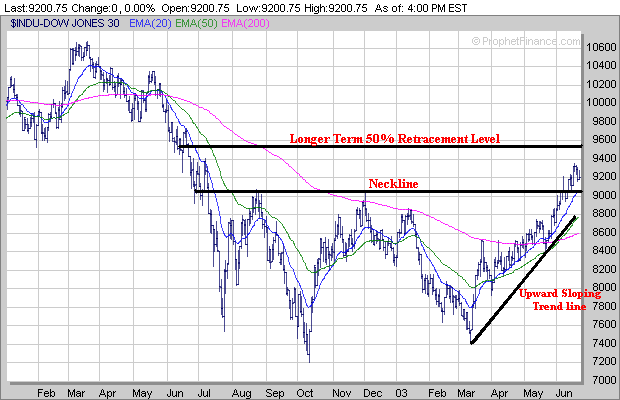
There are some key levels to watch in the Dow next week depending on which way the market swings. If the Dow makes one more upward move before undergoing a multi week correction the next area of upside resistance appears to be the 50% Retracement Level calculated from the early 2000 high (11908) to the October 2002 low (7177) which is at 9542. Meanwhile if the Dow begins to enter a consolidation/pullback stage the first level of support to watch is where its 20 Day EMA (blue line) and Neckline associated with its previous Inverted Head and Shoulders pattern intersect at just above 9000. If the Dow drops below 9000 the next support area is where its 50 Day EMA (green line) and upward sloping trend line from the March low are converging at near 8800.
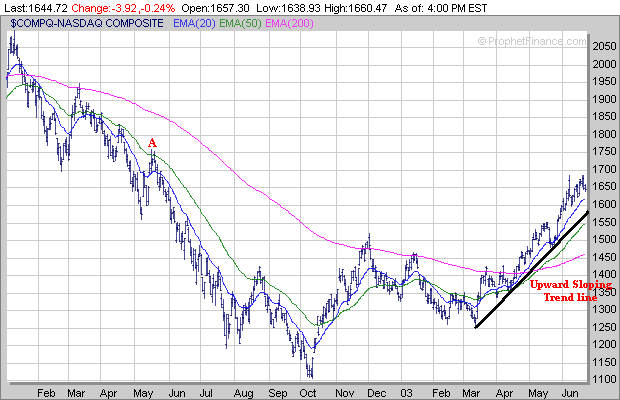
As for the the Nasdaq it's a little harder to determine where its next upside resistance level is at if it makes one more move higher but there maybe one near 1750 which corresponds to the mid May high of 2002 (point A). Meanwhile of the Nasdaq begins to go through a sustained consolidation/pullback cycle the first level of support to watch would be near its 20 Day EMA (blue line) around 1615. If the Nasdaq drops below 1615 level then the next area of support would be in the 1550-1575 range which corresponds to its upward sloping trend line from the March low and its 50 Day EMA (green line).
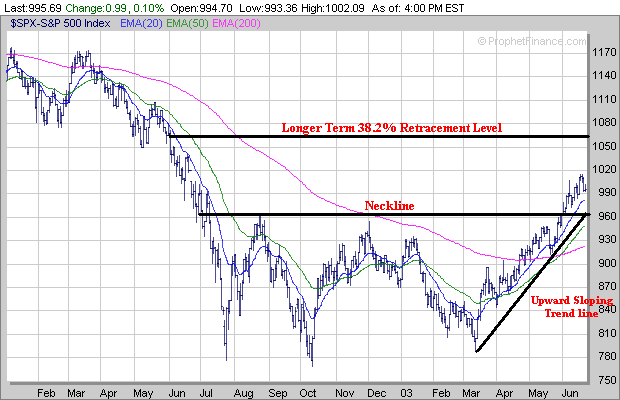
Moving on to the S&P 500 if it makes one more upside move before undergoing a sustained pullback the next area of significant upside resistance appears to be at the 38.2% Retracement Level near 1065 calculated from the early 2000 high to the October 2002 low. Meanwhile if the S&P 500 begins to go through a sustained consolidation/pullback phase and drops below its 20 Day EMA (blue line) the first key support level to watch is where its Neckline associated with its previous Inverted Head and Shoulders pattern intersects with its upward sloping trend line from the March low near 965. If the S&P 500 drops below 965 then the next support area would be at its 50 Day EMA (green line) near 950.
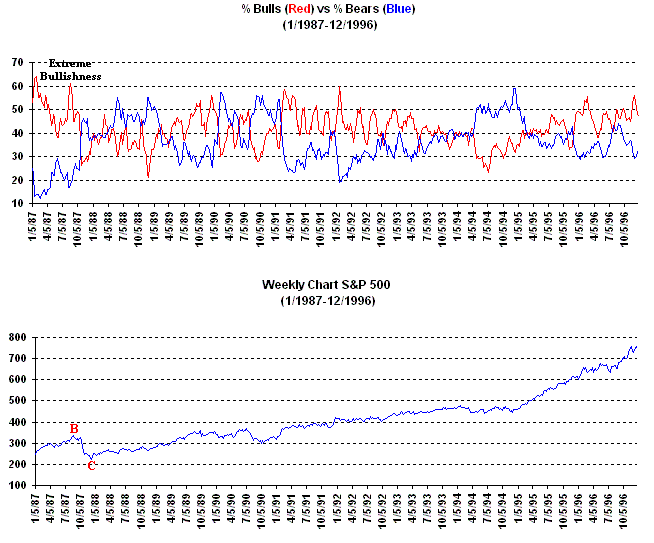
Meanwhile the amount of Bullishness and Complacency continue to increase and this is one reason I'm convinced that some type of consolidation/pullback phase will occur even if the major averages can rally going into the end of the month. The % difference between the Bullish and Bearish Investment Advisors is now at 44% and hasn't been this high since the Summer of 1987 as shown by the longer term chart of the Bullish Bearish Investment Advisor Sentiment from 1987-1996.
Without trying to be an alarmist you may also note that the extreme amount of Bullishness that was exhibited during the Summer of 1987 was a precursor to the Stock Market Crash during the Fall of 1987 in which the S&P 500 lost nearly 35% of its value (points B to C).
Meanwhile the Volatility Index (VIX) also remains very low and is still hovering near 20 which has usually been a signal of a nearing correction in the past (points D, E, F, G and H).
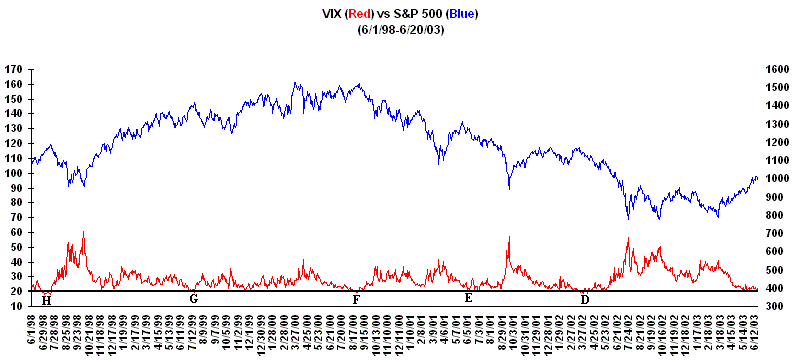
Even if the major averages can rally for a few more weeks into the end of the month I still believe that some type of multi week consolidation/pullback will occur before much longer as the signals are there for one to develop based on the Contrarian Indicators. Now this doesn't mean it will be a massive sell off like occurred in the Fall of 1987 but don't be surprised to see the major averages possibly retrace at least 23.6% of there moves beginning either from the October 2002 lows. Just keep in mind neither the major averages or an individual stock will go up or down in a straight line and will go through a series of pullbacks/rallies before resuming their longer term upward or downward trends.
Some of our Stocks we featured in the Month of March
along
with their Performance since then are shown below.
| Symbol | Date Featured | Chart Pattern | Initial Price | Highest Price through 6/20 | Gain |
| SOHU | 3/22/2003 | Cup/Handle | 9.55 | 35.63 | 273% |
| ASKJ | 3/29/2003 | Cup/Handle | 6.89 | 14.8 | 115% |
| VCLK | 3/29/2003 | Cup/Handle | 3.1 | 6.54 | 111% |
| OPTC | 3/15/2003 | Cup/Handle | 7.15 | 12.95 | 81% |
| OVTI | 3/15/2003 | Double Bottom | 21.18 | 37.48 | 77% |
| AVID | 3/29/2003 | Cup/Handle | 22.38 | 38.15 | 69% |
| AAI | 3/8/2003 | Cup/Handle | 6.05 | 9.75 | 61% |
| YHOO | 3/15/2003 | Cup/Handle | 20.69 | 33.19 | 60% |
| AMZN | 3/15/2003 | Cup/Handle | 24.71 | 37.24 | 51% |
| ||||||