
Stock Market Analysis for the Dow, Nasdaq and S&P 500
(6/28/03)
From a historical perspective since 1900 there have been 3 Secular Bull Markets and 3 Secular Bear Markets as shown by the tables below of the Dow and S&P 500. As you can see during a Secular Bull Market the Average Annual Return (highlighted in red) is considerably higher than during a Secular Bear Market (highlighted in blue). Thus the long term Buy and Hold strategy that worked well in the 1980's and 1990's for investors may have not worked very well during the Secular Bear Markets of 1906-1921, 1929-1949 and 1966-1982.
|
Secular Bear Markets vs Secular Bull Markets and Dow Performance |
|||||
| Secular Bear | Duration | Avg Yearly Ret | Secular Bull | Duration | Avg Yearly Ret |
| Markets | (Years) | (Dow) | Markets | (Years) | (Dow) |
| 1906-1921 | 16 | 1.58% | 1922-1928 | 7 | 17.20% |
| 1929-1949 | 21 | 1.69% | 1950-1965 | 16 | 10.60% |
| 1966-1982 | 17 | 1.59% | 1983-1999 | 17 | 15.30% |
| 2000-? | |||||
| Secular Bear Markets vs Secular Bull Markets and S&P 500 Performance | |||||
| Secular Bear | Duration | Avg Yearly Ret | Secular Bull | Duration | Avg Yearly Ret |
| Markets | (Years) | (S&P 500) | Markets | (Years) | (S&P 500) |
| 1906-1921 | NA | NA | 1922-1928 | 7 | 17.90% |
| 1929-1949 | 21 | 2.34% | 1950-1965 | 16 | 11.40% |
| 1966-1982 | 17 | 3.64% | 1983-1999 | 17 | 14.96% |
| 2000-? | |||||
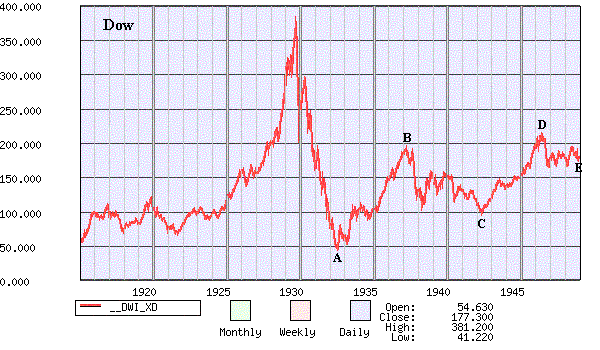
The big question is now are we in the beginning stages of a 4th Secular Bear Market which started in 2000. The average length of the previous 3 Secular Bear Markets was 18 years with a minimum of 16 years and a maximum of 21 years. Thus if you add 18 years to the year 2000 and take + or - 3 years on either side then the next Secular Bull Market may not begin until sometime in the 2015 to 2021 time period if we are now entering a 4th Secular Bear Market. However I would like to point out that even in a Secular Bear Market there can still be Bull Markets lasting a year or two as the longer term charts of the Dow show below.
Notice after the Secular Bull Market of 1922-1928 which was followed by a Secular Bear Market from 1929-1949 that the Dow still had impressive gains during the early to mid 1930s (points A to B) before going through another Bear Cycle prior too and during World War II (points B to C). This was then followed by another Bull Cycle from 1943-1946 (points C to D). However from the early part of 1937 (point B) until the end of 1949 (point E) the Dow virtually had a net gain of 0% as its basic overall pattern was a series of up and down movements which pretty much cancelled each other out.
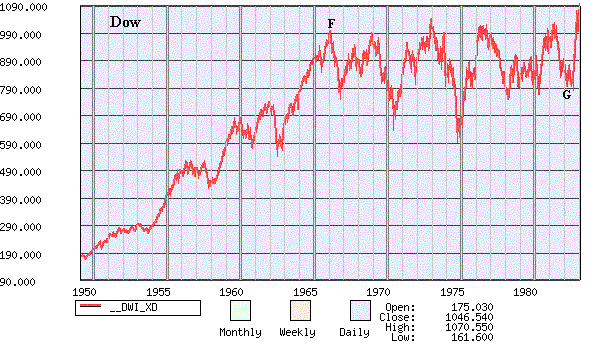
Meanwhile after the Secular Bull Market from 1950-1965 the Dow once again went through another Secular Bear Market from 1966-1982. Notice after the Dow peaked in early 1966 (point F) that it had a lot of upward and downward movements from 1966 through 1982 but it basically went nowhere and actually was lower at the end of 1982 (point G) versus its peak in early 1966 (point F).
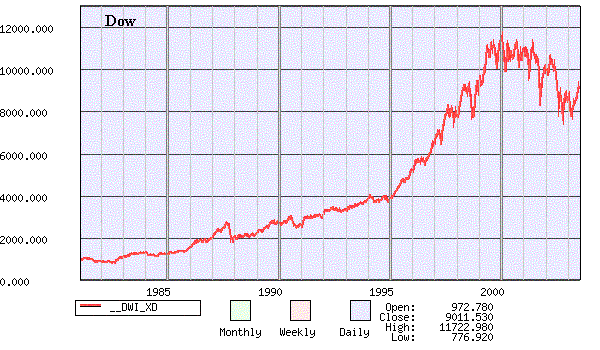
Looking at the current chart of the Dow shows that it has been exhibiting a choppy pattern similar to previous Secular Bear Market environments after experiencing a Secular Bull Market from 1983-1999. One has to wonder during the next 10 years or so whether the Dow will continue to exhibit a similar pattern that occurred from the mid 1960's through the 1970's in which it had a lot of downward and upward moves but the overall net gain was negligible.
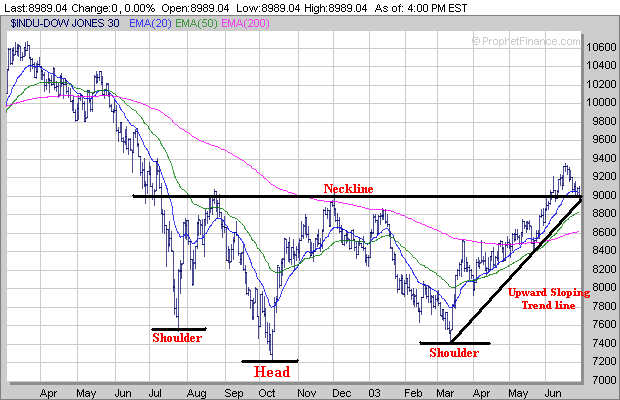
As far as the current market environment the Dow is near a critical short term support area around the 9000 level which is where its upward sloping trend line from the March low is intersecting with its Neckline in association with an Inverted head and Shoulders pattern. If the Dow fails to hold support near the 9000 level the next support area would be at its 50 Day EMA (green line) near 8800.
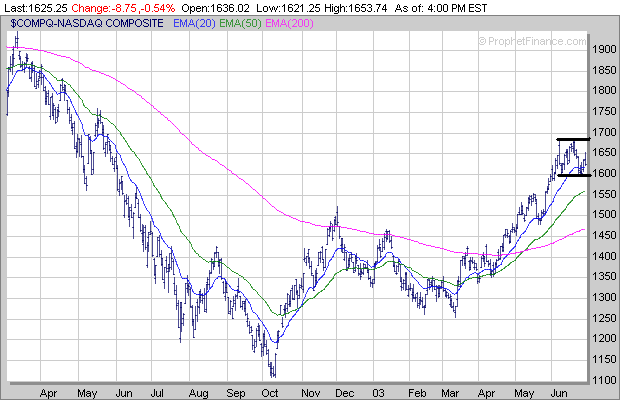
The Nasdaq has rallied back above its 20 Day EMA (blue line) and appears to have developed a trading range between 1600 and 1685. If the Nasdaq fails to hold support near 1600 the next area of support would be at its 50 Day EMA (green line) near 1560.
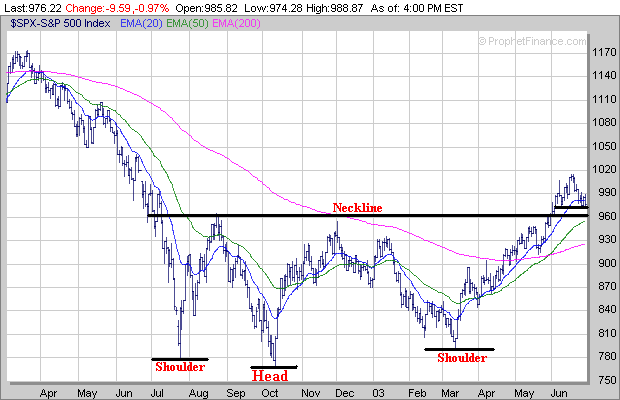
Meanwhile the S&P 500 so far has been hanging around its 20 Day EMA (blue line) and appears to have a short term support area near 975. If the S&P 500 fails to hold support near 975 then the next major support area is near 960 which is along the S&P 500's Neckline in association with its longer term Inverted head and Shoulders pattern and rising 50 Day EMA (green line).
If the month of June closes with a positive return which it should this would be the 4th month in a row that the major averages have had a positive return. My research shows that both the Dow and S&P 500 haven't had 4 straight consecutive positive months in a row since late 1998. So this has been a rare event since the Bull Market ended in early 2000 and the Bear Market began.
Meanwhile the % difference between the Bullish and Bearish Investment Advisors still remains above the 40% level which is an extreme reading and the Volatility Index remains very low as well and has hovered in the lower 20s for the 7th week in a row. Thus there still is an extreme amount of Bullishness and Complacency in the market which may continue to lead to some type of consolidation/pullback phase which appears to be currently developing.
If the consolidation/pullback continues as we move into the month of July start looking for those stocks which are developing a favorable chart pattern such as a Cup and Handle, Double Bottom or Flat Base as those will be the ones to watch if the market makes another significant move down the road.
| ||||||