
Stock Market Analysis for the Dow, Nasdaq and S&P 500
(6/7/03)
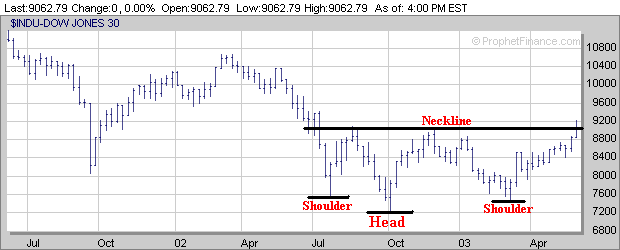
There were several positive develops this past week as both the Dow and S&P 500 broke above longer term resistance areas. The Dow broke above its Neckline in association with its Inverted Head and Shoulders pattern and closed near its Neckline on Friday.
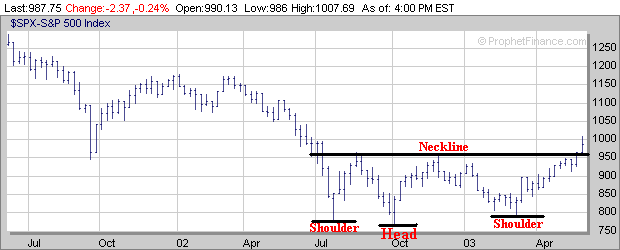
Meanwhile the S&P 500 broke solidly above its Neckline in association with its Inverted Head and Shoulders pattern as well.
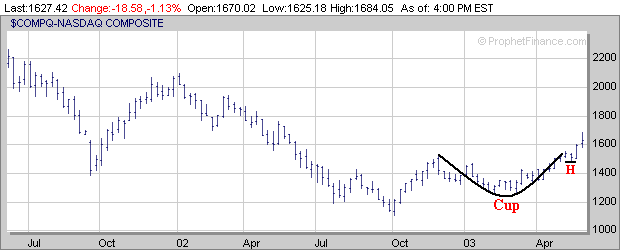
The Nasdaq continued to follow through this past week after breaking out of a small Cup and Handle (H) pattern the week before.
Despite all of the positive developments last week there was one very big negative development on Friday which was the strong intra day reversal that occurred on extremely high volume. This type of action is a strong signal of a potential market top. This doesn't mean the market is going to crumble but everyone should be aware that the major averages have become very overextended and are due for a pullback. The major averages have made a great run over the past 13 weeks but this type of action isn't sustainable and even if this is the beginning of a possible new Bull Market, as some are claiming, pullbacks are going to occur.
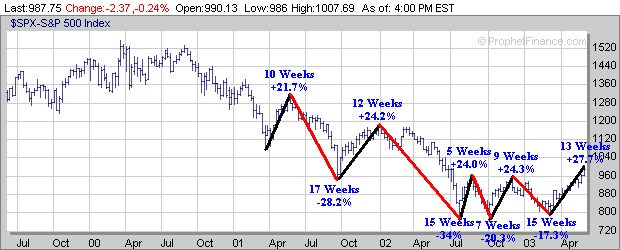
If we look at the chart of the S&P 500 since it peaked in early 2000 there have been 4 previous strong Bear Market rallies prior to this most recent rally in which the S&P 500 rallied from 5 to 12 weeks with an average gain around 24%. Over the past 13 weeks the S&P 500 has rallied nearly 28% based on Friday's intra day high near 1008. During the previous four times the S&P 500 has gained 22% or more a substantial sell off has followed lasting several weeks (7 to 17 weeks) with losses ranging from 17.3% to 34%. If we are seeing the early stages of a new Bull Market which several analysts are predicting then any type of pullback that develops over the next few weeks should be limited in scope.
What I would like to see over the next several weeks is for a constructive pullback to develop in which the major averages don't retrace more than 23.6% to 38.2% of their moves from early March to their intra day highs made on Friday similar to what transpired in 1999. If we go back and look at what happened in late 1998 into 1999 the S&P 500 made a 13 week run after making a bottom in October of 1998 (point A) and then consolidated for 8 weeks before renewing its upward trend over the next 4 months before peaking in July of 1999 (point B).
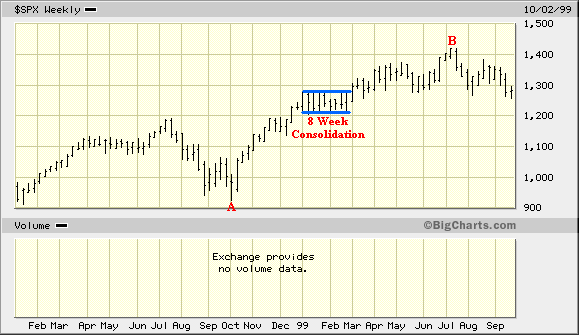
Notice during the 8 week consolidation period in early 1999 that the S&P 500 didn't retrace more than 23.6% (point C) of its move that began in early October of 1998 and ended during the 1st week of 1999.
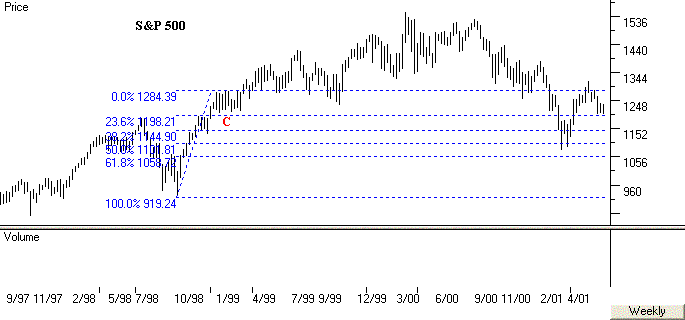
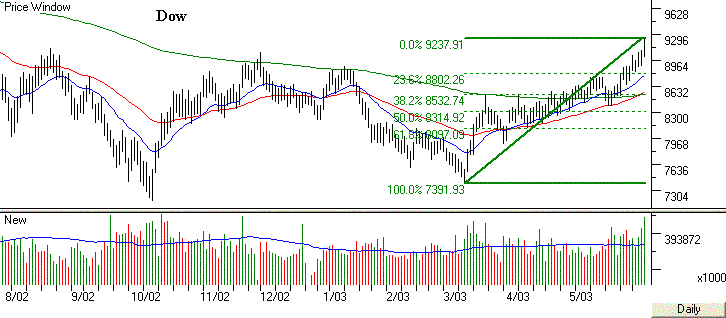
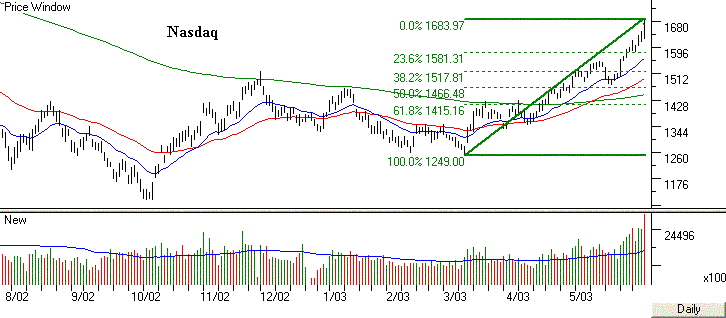
Now let's look at the current charts of the major averages and overlay their Exponential Moving Averages (EMA) along with their Retracement Levels calculated from the early March lows to the intra day highs made on Friday.
The chart of the Dow shows that its 20 Day EMA (blue line) is approaching its 23.6% Retracement Level near 8800 so that is a key support area to watch if the Dow begins to pullback.
As for the Nasdaq its 23.6% Retracement Level is near 1580 so that will be the first area to watch for support at if it begins to pullback.
The chart of the S&P 500 shows that its 20 Day EMA (blue line) is also near its 23.6% Retracement Level around the 955 area which by the way is also near the Neckline associated with the Inverted Head and Shoulders pattern as well. Thus the 955 level appears to be a key support area for the S&P 500 if a pullback develops.
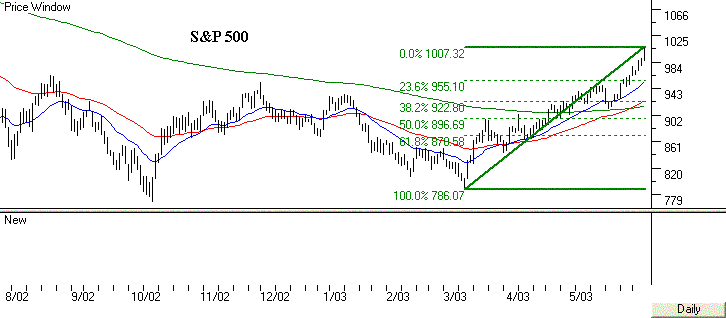
The next correction phase that develops in the market is going to give us a clue as to whether the action over the past 13 weeks was just another strong Bear Market rally which will give way to another substantial sell off which has occurred four separate times since early 2000 or whether this is actually the beginning of a new Bull Market which some analysts are predicting. If this is the beginning of a potential new Bull Market then the major averages should develop some type of constructive pullback in which they don't retrace more than 23.6% to 38.2% of their prior moves from early March to the highs made on Friday similar to what occurred in early 1999.
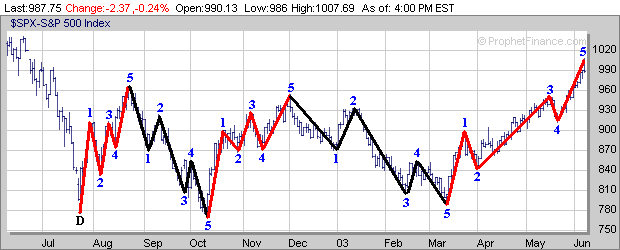
I thought this week I would talk about Elliot Waves and how it may apply to the market from both a short term and long term perspective if you believe its concepts. Some market technicians have noticed over the past several years that the market will consistently move in a 5 wave pattern which is based on concepts from Elliott Wave Theory. When the market is trending upward a 5 wave pattern consists of 3 separate moves upward and 2 separate moves downward before a top occurs. Meanwhile when the market is trending downward a 5 wave pattern consists of 3 separate moves downward and 2 separate moves upward before a bottom occurs.
For example let's look at the short term perspective first and analyze the S&P 500. Notice when it made a bottom in the July of 2002 (point D) and rallied until late August of 2002 that it had 3 separate upward moves (D to 1, 2 to 3 and 4 to 5) and 2 separate downward moves (1 to 2 and 3 to 4). Next the S&P 500 then sold off from late August of 2002 until early October of 2002 which consisted of 3 separate downward moves (5 to 1, 2 to 3 and 4 to 5) and 2 separate upward moves (1 to 2 and 3 to 4). The S&P 500 then rallied from early October of 2002 until late November of 2002 which once again consisted of 3 separate upward moves (5 to 1, 2 to 3 and 4 to 5) and 2 separate downward moves (1 to 2 and 3 to 4). This was then followed by another sell off which had 3 separate downward moves (5 to 1, 2 to 3 and 4 to 5) and 2 separate upward moves (1 to 2 and 3 to 4) before the S&P 500 made a bottom in early March of 2003. Meanwhile over the past 13 weeks it appears the S&P may have just completed another 5 Wave pattern with 3 separate upward moves (5 to 1, 2 to 3 and 4 to 5) and 2 separate downward moves (1 to 2 and 3 to 4). The question is now has the S&P 500 made a top and will it begin to go through another 5 Wave pattern correction phase?
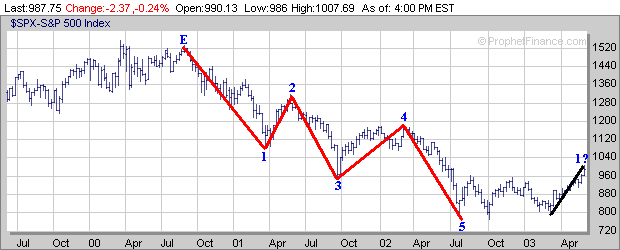
Meanwhile if we look at the S&P 500 from a longer term perspective it appears the S&P 500 made a similar 5 Wave pattern from 2000-2002 with 3 separate downward moves (E to 1, 2 to 3 and 4 to 5) and 2 separate upward moves (1 to 2 and 3 to 4). Now if you want to take a positive view on things is the most recent run in the S&P 500 over the past 13 weeks the 1st upward move in a newly developing longer term 5 Wave pattern? Only time will tell whether this will be the case or not.
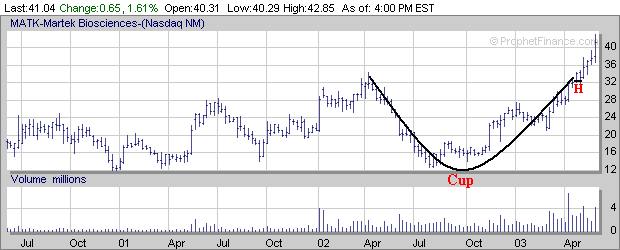
Finally a review of our Stock of the Month for May which was MATK shows that it gained nearly 31% after we featured it in early May. MATK only developed a small 2 week Handle (H) after forming a 1 year Cup before breaking out so it did manage to follow through to the upside since the market was strong.
If the market does begin to pullback over the next few weeks make sure to keep a list of those stocks which are holding up well and developing a favorable chart pattern.
| ||||||