
Stock Market Analysis for the Dow, Nasdaq and S&P 500
(7/12/03)
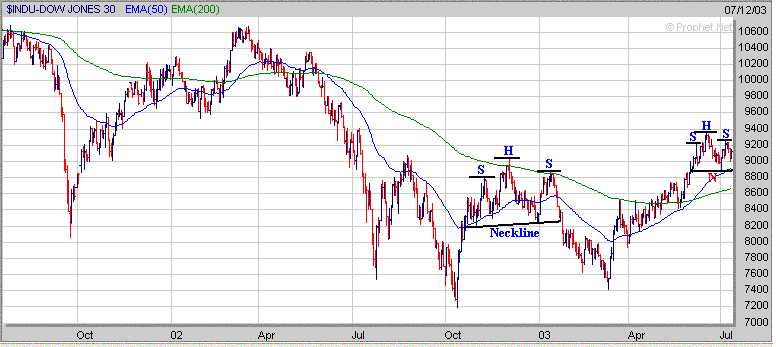
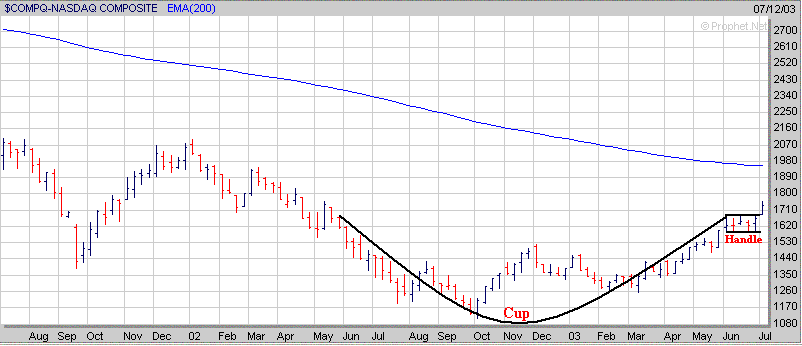
The Nasdaq continues to perform the best of the three major averages as it broke out of a favorable longer term Cup and Handle pattern earlier in the week. However the Dow and S&P 500 still haven't been able to rally above their mid June highs and in the near term appear to be potentially developing a mini Head (H) and Shoulders (S) pattern.
A similar pattern, although on a much larger scale, occurred late in 2002 into the early part of 2003 in the Dow and S&P 500. This eventually led to a significant decline as the Neckline support areas were breached in which the Dow dropped from 9100 to 7400 and the S&P 500 fell from 955 to 790. Based on the fact that the current mini Head and Shoulders pattern has developed over a much shorter period of time and is on a much smaller scale than its previous one in late 2002 into early 2003 if some selling pressure does come into the market I wouldn't expect as big as a drop like occurred with the previous one.
The initial support area to watch in the Dow is where its Neckline (N) and 50 Day EMA (blue line) are converging at near 8900. If the Dow fails to hold support near 8900 then the next area of support would be at its 200 Day EMA (green line) near 8650.
As for the S&P 500 the initial support area to watch is at the 960 level which is also where its Neckline and 50 Day EMA (blue line) have converged at as well. If the S&P 500 drops below the 960 level then the next major support area resides at its 200 Day EMA (green line) near 930.
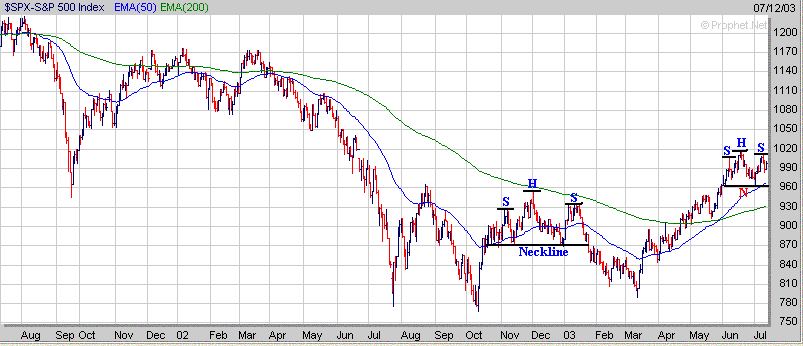
Meanwhile if the Dow and S&P 500 can break above their mid June highs which are currently acting as the Head of their mini Head and Shoulders patterns then this would be a positive sign and confirm the breakout attempt of the Nasdaq.
As mentioned in the beginning the Nasdaq appears to have broken out of a favorable Cup and Handle pattern in the near term and should hold support near the top of its Handle (around 1685) if any selling pressure redevelops in the market. If the Dow and S&P 500 can break above their mid June highs and negate the potential mini Head and Shoulders pattern then this would confirm the breakout in the Nasdaq with the next major level of upside resistance at its Weekly 200 Day EMA (blue line) which is above the 1900 level.
Thus we have two possible scenario's to watch for over the next few weeks as either the Dow and S&P 500 will eventually rise above their mid June highs and confirm the recent breakout attempt by the Nasdaq or they will come under some selling pressure due to their potential mini Head and Shoulder patterns.
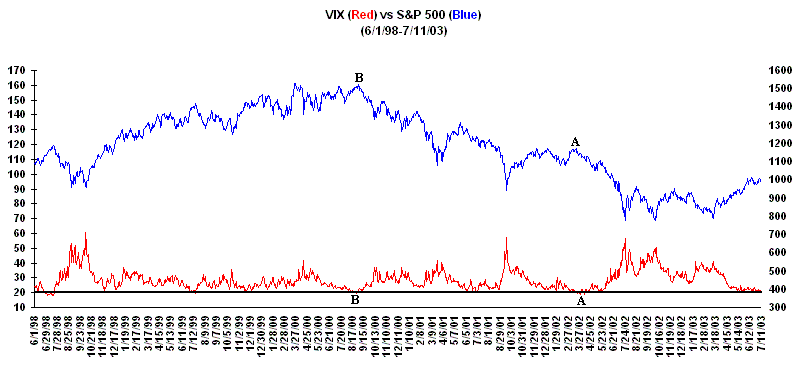
Meanwhile the Volatility Index (VIX) continues to move sideways and has been hovering in the lower 20s for the past 9 weeks which is a rather long time for it to remain at such low levels. Over the past few years when the VIX has remained at a very low level for an extended period of time this has led to renewed selling pressure. Some examples include the Spring of 2002 (point A) and back in the Summer of 2000 (point B). The question is can the major averages make another significant move upward with the VIX reading this low?
| ||||||