
Stock Market Analysis for the Dow, Nasdaq and S&P 500
(7/19/03)
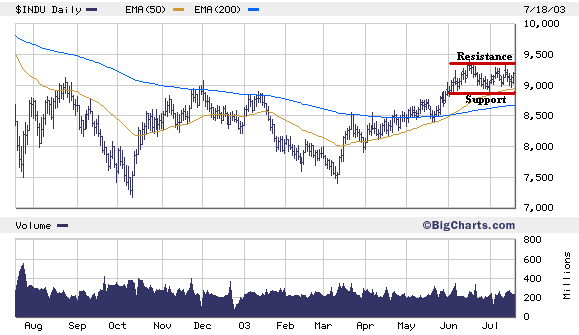
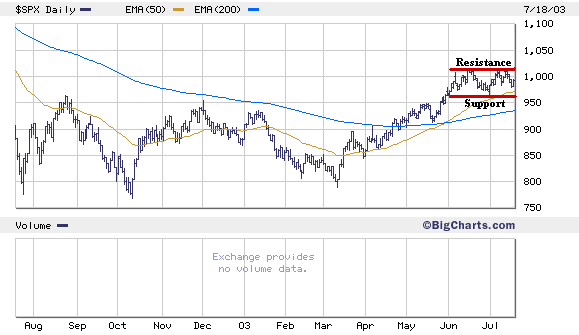
Not much was revealed this past week in the Dow and S&P 500 as they continue to remain range bound between their mid June highs and early July lows while the Nasdaq sold off hard on Thursday.
The Dow and S&P 500 so far have been holding support above their early July lows but have been encountering resistance at their mid June highs. Eventually they will either break above their resistance levels and make another significant move upward or drop below their support levels leading to a more substantial sell off.
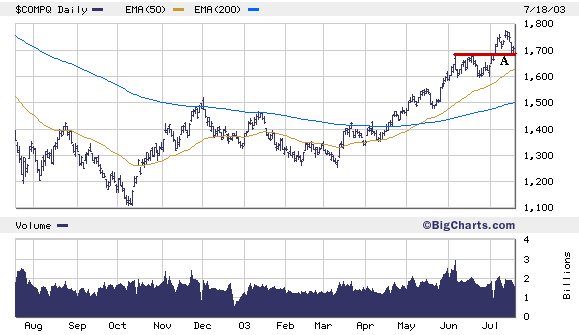
The Nasdaq which broke out of its 4 week trading range in early July encountered its first significant week of selling pressure since mid June. For the Nasdaq to remain constructive in the near term it needs to hold support near the top of its previous trading range which was around 1685 (point A). If the Nasdaq drops below the 1685 level its next major support area appears to be its 50 Day EMA (brown line) near 1625.
Meanwhile the Contrarain Indicators continue to show no change in investor sentiment towards the longer term outlook for the market as the % difference between the Bullish and Bearish Investment Advisors remains quite high.
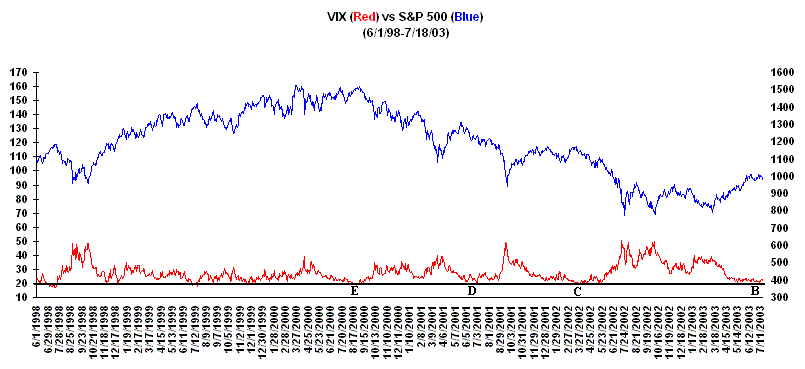
In addition the Volatility Index (VIX) also has remained quite low and has been hovering in the lower 20's for the past several weeks (point B). In the past when the VIX has remained at low levels for an extended period this has been a precursor to a sell off such as occurred in the the Spring of 2002 (point C), Summer of 2001 (point D) and Summer of 2000 (point E).
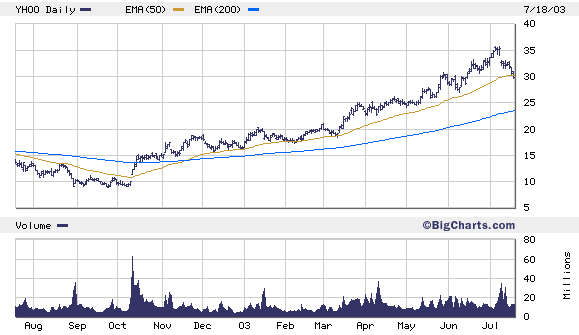
Some stocks which have been helping leading the major averages higher since they made a low last October are showing signs they are getting ready to rollover. One example is Yahoo (YHOO) which was one of the first stocks to breakout in mid October (point F) accompanied by strong volume as the market made a bottom. From mid October until June YHOO had always found support near its 50 Day EMA (brown line) on every pullback attempt. On Friday YHOO closed below its 50 Day EMA so watch it closely as this could be an ominous sign for the rest of the market especially if it breaks strongly below its 50 Day EMA.
| ||||||