
Stock Market Analysis for the Dow, Nasdaq and S&P 500
(7/26/03)
The Dow and S&P 500 still remain in their respective trading ranges and the question remains which direction will they eventually break. The Dow has basically been in an 8 week trading range outside of the brief gap up in mid June and the brief gap down in early July. The Dow has two possible scenario's. The first scenario would be for it to break solidly above above its mid July high near 9350 and make a run up to the 10000 level (point A) which is where its longer term 61.8% Retracement Level resides at calculated from the early 2000 high to the October 2002 low.
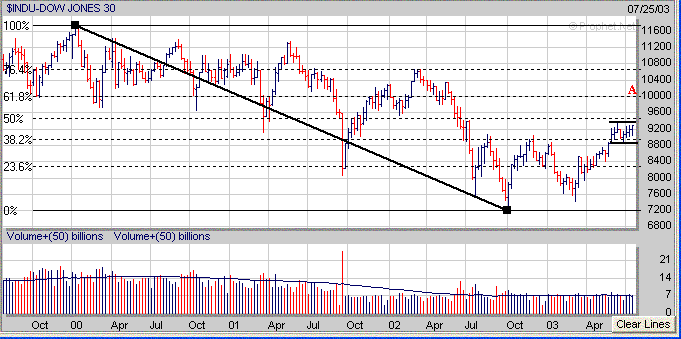
The second scenario would be for the Dow to break below the bottom of its recent 8 week trading range near 8850 with its first support area near its 200 Day EMA (blue line) around 8700. If the Dow broke below its 200 Day EMA its next level of support would be at its 38.2% Retracement Level near 8600 which is calculated from the March low to the mid July high.
As for the S&P 500 it also has remained in an 8 week trading range and also has two possible scenarios. The first scenario would be for the S&P 500 to break convincingly above its mid July high near 1015 and then make a run up to its longer term 38.2% Retracement Level near 1070 (point B) which is calculated from its early 2000 high to the October 2002 low.
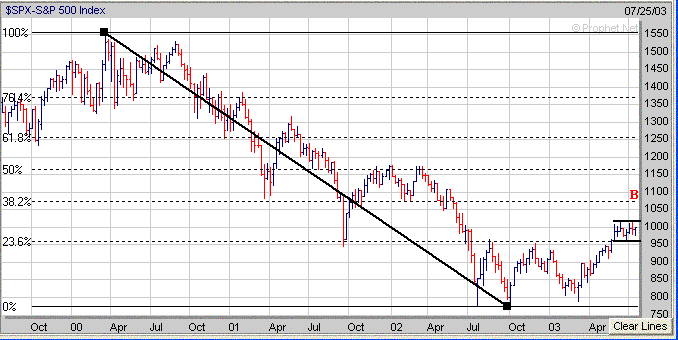
Meanwhile the second scenario for the S&P 500 would be for it to drop below the lower end of its 8 week trading range near 960 with its next support area in the the 928 to 935 range which coincides with its 200 Day EMA (935) and 38.2% Retracement Level (928) calculated from the March low to the mid July high.
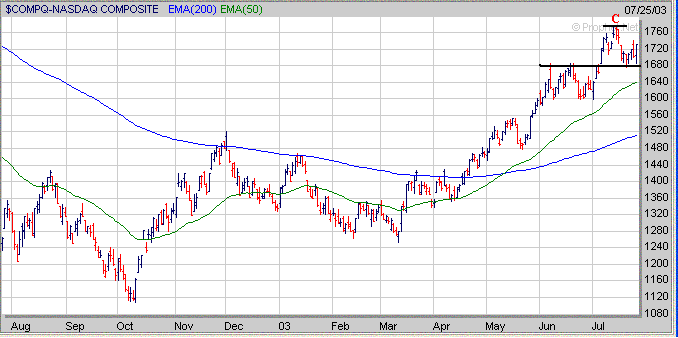
The Nasdaq held support this past week near the top of its prior 4 week trading range near 1680. If the Nasdaq tries to rally next week I would look for resistance at its mid July high near 1775 (point C). Meanwhile if the Nasdaq drops below its prior trading range near 1680 then the next area of support would be at its 50 Day EMA which is now near 1640.
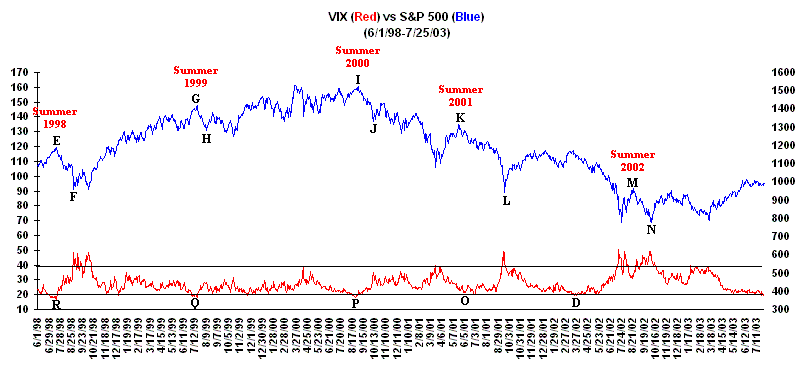
Despite the rally on Friday I'm still concerned with the length of time the Volatility Index (VIX) has remained at very low level which has now completed its 11 week in the lower 20's. In addition the VIX closed below 20 on Friday for the first time since the Spring of 2002 (point D). Furhermore since 1998 there has been some type of sell off in the market each Summer (points E to F, G to H, I to J, K to L and M to N) with most of them being accompanied by a very low reading in the VIX (points O, P, Q and R). The question remains can the major averages make a significant upward move in the weeks ahead with the VIX currently at this low of a level?
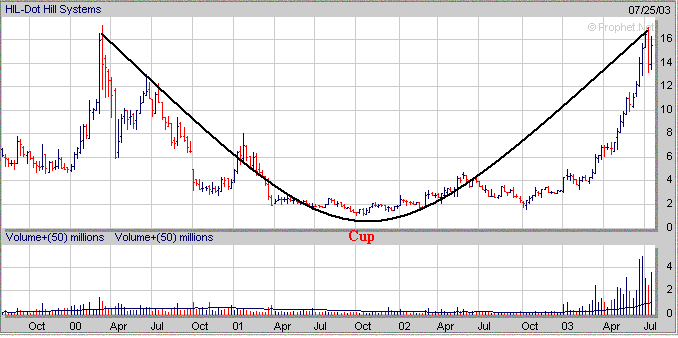
No matter what happens in the weeks ahead you have to be prepared for the next major move whether it's to the upside or downside. Continue to focus on those stocks which are developing a favorable chart pattern (Cup and Handles, Double Bottoms and Flat Bases) and are exhibiting good Sales and Earnings Growth. A recent example of a stock which has formed the right side of a long 3 year Cup and is just starting to experience increasing Sales and Earnings Growth is HIL. HIL now needs to begin developing a constructive Handle over the next few weeks before making another significant move higher.
Cick
Here to Signup
for a "Free" 2 Week Trial Membership
and see what other stocks are beginning to develop a favorable Chart Pattern
similar to HIL
| ||||||