
Stock Market Analysis for the Dow, Nasdaq and S&P 500
(7/4/03)
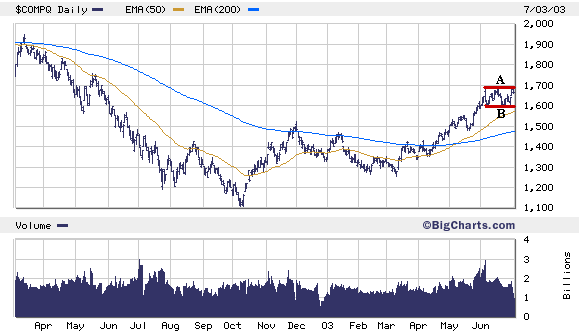
So far the major averages have been exhibiting a constructive consolidation/pullback phase since peaking in early to mid June. The Nasdaq has been in a 4 week trading range since early June and has encountered resistance near 1685 (point A) while finding support near the 1600 level (point B) as it has remained above its 50 Day Exponential Moving Average (EMA). Eventually the Nasdaq is going to break out of this trading range and make a significant move in one direction of the other.
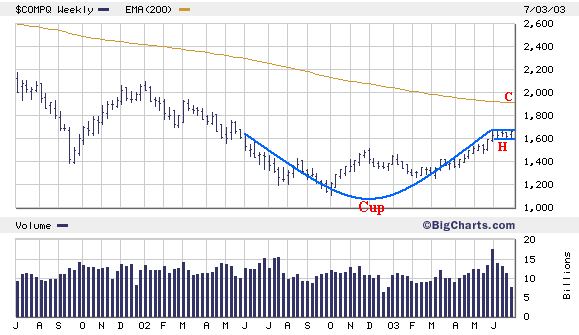
Meanwhile if we look at a weekly chart of the Nasdaq over the past 2 years it now appears that it could be forming a bullish looking O'Neil Cup and Handle (H) pattern with the Pivot Point just above 1685. If the Nasdaq can break out of its Handle accompanied by strong volume then it could make a quick move up to 1900 or so (point C) which is at its 200 Day EMA calculated on a weekly basis.
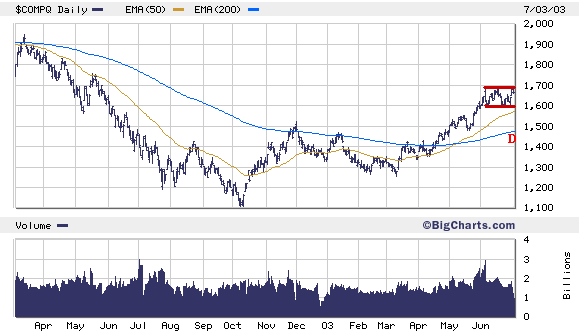
On the other hand if the Nasdaq breaks below the key support level near 1600 then it could make a quick tumble back to its daily 200 Day EMA (blue line) which is now near 1480 (point D).
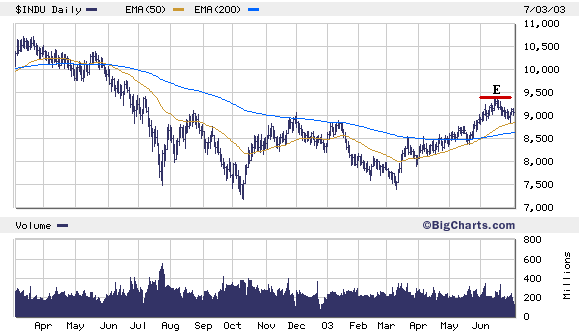
As for the Dow it found support last week near its 50 Day EMA around 8850 so this is an important support area to watch over the next few weeks. If the Dow breaks below its 50 Day EMA then the next area of support would be at its 200 Day EMA (blue line) near 8600. Meanwhile look for resistance at the Dow's mid June high near 9400 (point E) on any rally attempt.
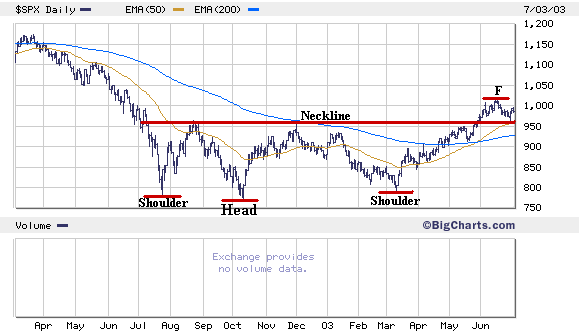
The S&P 500 held support near the 960 level this week which is along its Neckline in association with its longer term Inverted Head and Shoulders pattern and is also near its rising 50 Day EMA. Thus the 960 level is a key support level to watch over the next few weeks. If the S&P 500 drops below the 960 area the next major support level would be at its 200 Day EMA (blue line) near 928. Meanwhile if the S&P 500 tries to rally look for initial resistance at its mid June high near 1015 (point F).
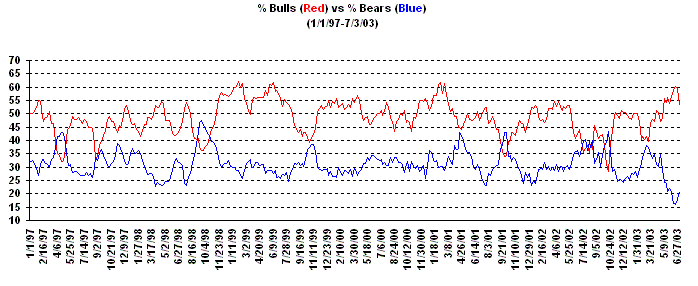
As far as the Contrarian Indicators there has been a slight weakening in the amount of Bullishness among the Investment Advisors the past few weeks as the market has begun to pullback however there is still a large % difference between the Bullish and Bearish Investment Advisors.
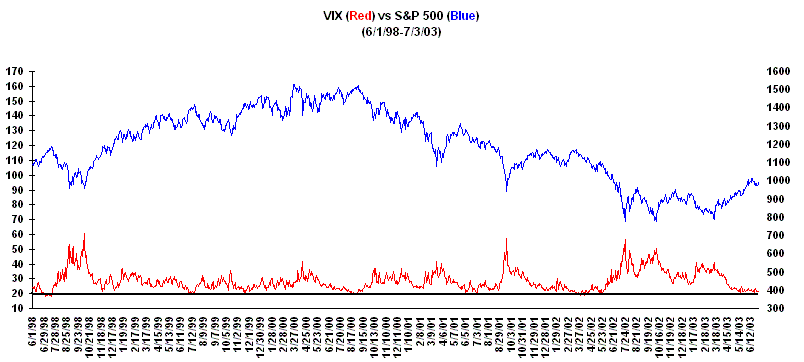
Meanwhile the Volatility Index (VIX) for the 8th consecutive week has remained in the lower 20's as a considerable amount of complacency still exits in the market.
Despite the continued excessive amount of Bullishness and Complacency that still exists in the market we can't ignore the potential O'Neil "Cup and Handle" pattern that the Nasdaq is currently developing as it has been providing leadership since the October 2002 bottom. The longer the Nasdaq can remain in a favorable consolidation phase and continue to hold support above the 1600 level while working on its Handle the higher the odds that its next major move will be to the upside.
Thus continue to search for those stocks which are developing a favorable chart pattern such as a Cup and Handle, Double Bottom or Flat Base as those will be the ones to watch if the market (especially the Nasdaq) makes one more significant move upward before the end of the year. Over the past few weeks I have been noticing an increasing number of stocks which have formed a the right side of a Cup and now are working on their Handles so that is a good sign.
| ||||||