
Stock Market Analysis for the Dow, Nasdaq and S&P 500
(8/16/03)
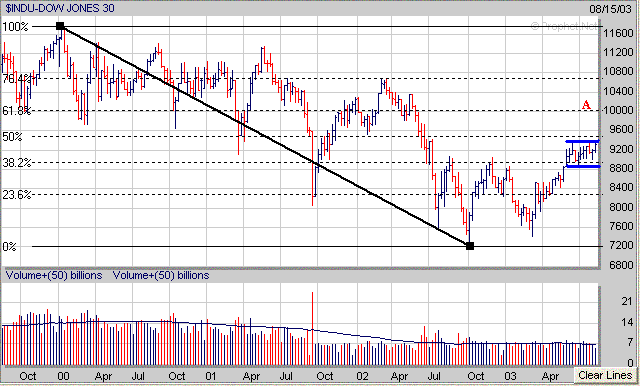
It's beginning to sound like a broken record but the Dow and S&P 500 remain in their respective trading ranges which have been in place since June. At some point they will break out of their trading ranges however it's still not clear which direction they will go.
A weekly chart of the Dow shows it has been in a trading range for 10 weeks with the upper end of the range just above 9350 with the lower end near 8875. If the Dow does breakout to the upside accompanied by increasing volume then the next level of significant upside resistance appears to be around 10000 (point A) which corresponds to the 61.8% Retracement calculated from the early 2000 high to the October 2002 low.
Meanwhile as shown by the daily chart of the Dow it has been finding support near its 50 Day EMA (blue line) while remaining in its 10 week trading range. If the Dow breaks below its 50 Day EMA then its next level of support would be in the 8880-8875 range which corresponds to the bottom of its trading range and 200 Day EMA (green line).
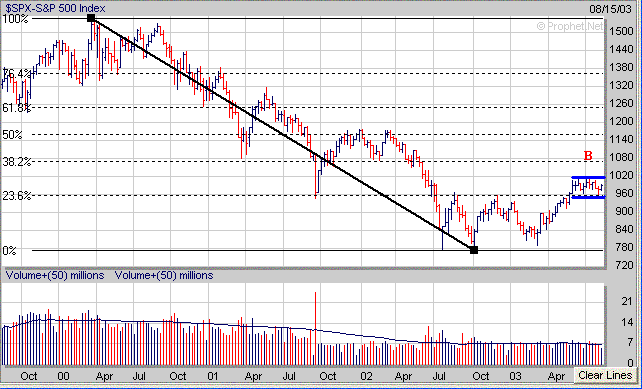
The weekly chart of the S&P 500 shows it has been in a 10 week trading range as well with the top of the range at 1015 and the bottom near 960. If the S&P 500 breaks out of its trading range to the upside then the next level of upside resistance resides near 1068 (point B) which corresponds to its 38.2% Retracement calculated from the early 2000 high to the October 2002 low.
Meanwhile if the S&P 500 breaks to the downside instead and drops below the 960 level then the next area of support would be in the 930-940 range which corresponds to its 200 Day EMA (green line) and 38.2% Retracement (dashed black line) calculated from the March 2002 low to the June high.
As far as the Nasdaq it did manage to hold support just below its 50 Day EMA and bounced this past week but it rallied on very poor volume (point C). However you can't really count Friday due to the power problems in the Northeast. Meanwhile the Nasdaq still looks like it could be forming a potential Head and Shoulders Top pattern with the key Neckline support near 1600.
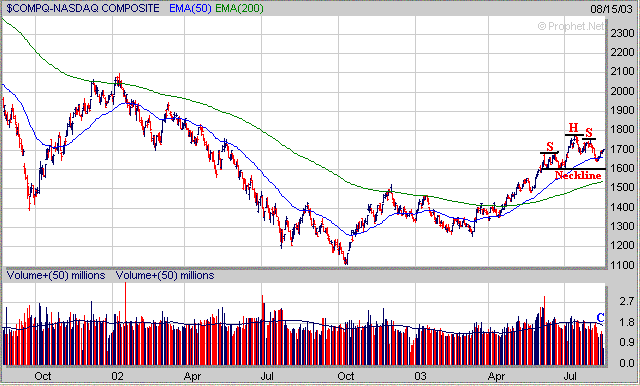
If the Nasdaq can avoid the Head and Shoulders Top pattern and break above its mid July high near 1775 then it has the potential to rise back to its weekly 200 Day EMA (blue line) which is currently near 1915.
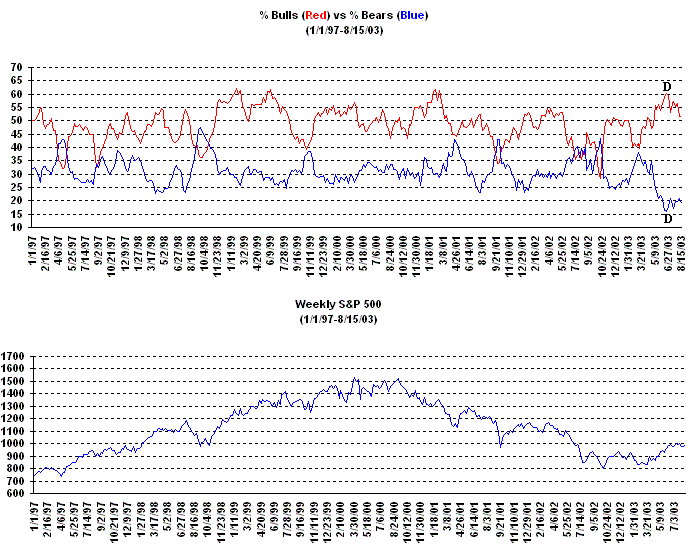
Despite the major averages trading nearly sideways since June especially in the Dow and S&P 500 there has been little change in the amount of Bullishness or Complacency among the investment crowd.
Although the % difference between the Bullish and Bearish Investment Advisors has narrowed a little bit since peaking in June (points D) it still remains quite high.
Meanwhile the Volatility Index (VIX) which did spike up briefly a few weeks ago (point E) has once again dropped back to near the 20 level this past week.
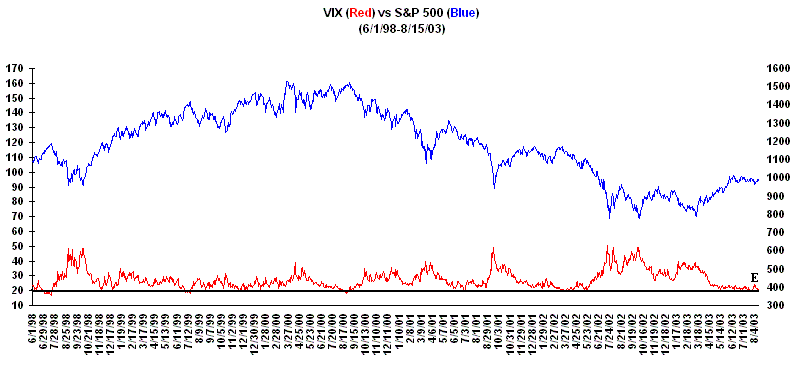
Thus the question remains can the major averages make one more significant move upward with still an overabundance of Bullishness and Complacency still existing in the market?
From a historical perspective we are approaching a weak period for the market as since 1900 the worst performing month for the Dow has been September as shown by the table below. Now this doesn't mean the Dow has to go down during the month of September however it has nearly 70% of the time since 1900 with an average loss of 4.7%. So it will be interesting to see what happens this year.
| Monthly Performance of Dow from 1900-2002 | |||||
| Month | % of (+) | % of (-) | Average Return | Average Loss | Average Return |
| Months | Months | (+) Months | (-) Months | (1900-2002) | |
| January | 63% | 37% | 3.66% | -3.58% | 1.02% |
| February | 49% | 51% | 3.06% | -2.94% | 0.30% |
| March | 59% | 41% | 3.59% | -3.72% | 0.57% |
| April | 57% | 43% | 4.58% | -3.50% | 1.08% |
| May | 54% | 46% | 3.43% | -4.18% | -0.08% |
| June | 48% | 52% | 4.25% | -3.20% | 0.34% |
| July | 61% | 39% | 4.50% | -3.53% | 1.42% |
| August | 65% | 35% | 3.86% | -4.47% | 0.99% |
| September | 31% | 69% | 3.49% | -4.69% | -1.31% |
| October | 59% | 41% | 3.60% | -4.54% | 0.32% |
| November | 59% | 41% | 4.69% | -5.28% | 0.63% |
| December | 70% | 30% | 3.13% | -3.07% | 1.27% |
| Average Yearly Return (1900-2002) | 6.55% | ||||
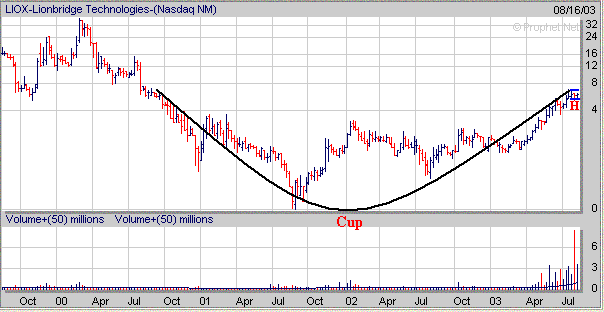
As mentioned above eventually the market is going to make a significant move in one direction or the other before much longer and as an investor you have to be ready for it no matter which direction it goes. If the market breaks to the upside those stocks which have been developing a favorable chart pattern since June will likely become the next leaders. Here is a current example of a stock which has been developing a favorable "Cup and Handle" pattern.
LIOX has developed a small Handle (H) over the past 3 weeks after forming the right side of a 3 year Cup. Its Pivot Point (Breakout Price) is around $7.25.
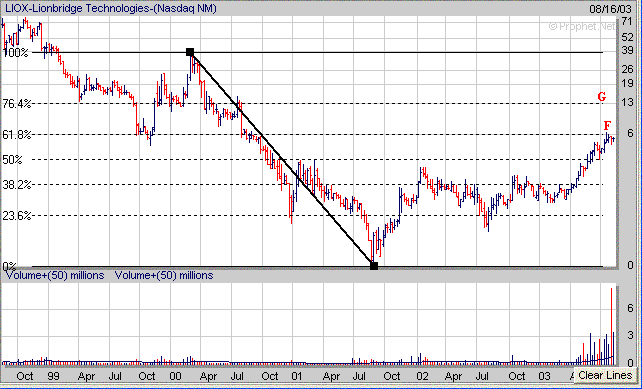
Meanwhile if you don't think Fibonacci Retracement Levels come into play in a stock take a look at where LIOX encountered resistance at below. Notice how it ran into resistance right at its 61.8% Retracement (point F) calculated from the early 2000 high to the late Summer 2001 low. Now if LIOX can break out of its Handle and follow through to the upside on good volume the next level of upside resistance would be at the 76.4% Retracement near $13 (point G).
In addition each Stock in our List includes
specific Pivot Points (Buy Prices), Stop Loss Prices and
potential Target Prices
| ||||||