
Stock Market Analysis for the Dow, Nasdaq and S&P 500
(8/2/03)
Not much has changed from this time last week as both the Dow and S&P 500 remain stuck in their respective trading ranges. The Dow did try and break out of its trading range on Thursday morning but reversed strongly in the afternoon which led to a failed breakout attempt and caused more selling pressure on Friday.
One thing to watch closely next week is the Volatility Index (VIX) which broke to the upside strongly on Friday (point A). If it rises significantly above its downward sloping trend line (black line) that was established in early May then this could lead to a more substantial sell off much like occurred in January of 2003 or December of 2002 when the VIX spiked strongly upward (points B to C and D to E).
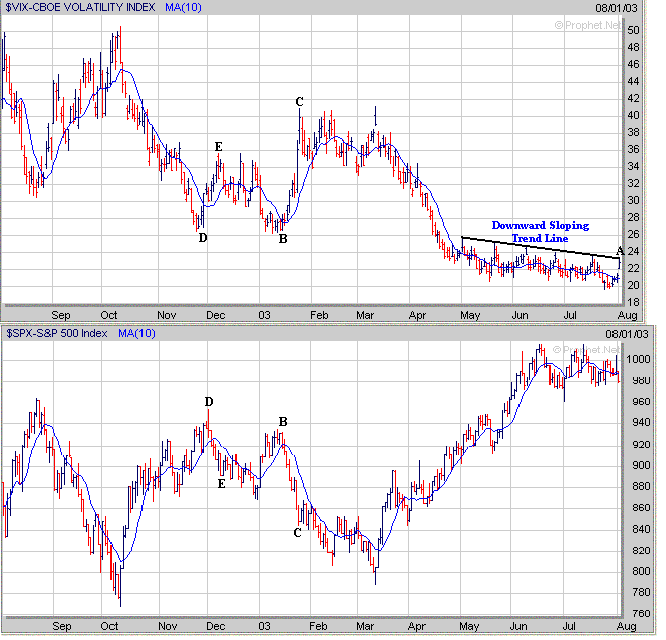
Meanwhile there was some historical analysis of the VIX provided by Larry Conners of TradingMarkets yesterday on Yahoo Finance. A brief summary of his analysis is given below.
"Yesterday we looked at the fact that periods of low volatility are followed by high volatility and that periods of high volatility are followed by periods of low volatility. Obviously, we are in a a tight trading range (low volatility) that will likely lead to a substantial breakout one way or another. Which direction that breakout will take is never perfectly known, but let's look at some historical statistics to guide us. And, in my opinion, the best indicator to help get us to an opinion is the VIX.
Through today, the VIX has gone 98 consecutive days without making a new 20-day high. This ties the longest streak since the VIX's inception in 1986. The other time this happened, it ended on 9/6/00. After making that 20-day high, the S&P immediately lost 10% of its value over the next month and a half. The third-longest period the VIX went without making a new 20-day high was 72 days ending 8/11/87. This preceded the crash of October 1987 The fourth-longest period was 71 days ending 1/24/03. From there the S&Ps fell almost 7% in the following 3 weeks.
What does this tell us? That at least looking back, when we've seen such sustained periods of low VIX readings, the market has responded by dropping. Now, I'll be the first to tell you, this absolutely does not mean that is what has to happen again. There are many good solid reasons prices have risen over the past 4 months. But, when you look at things on a historical and statistical basis as I do, it's sending us a strong caution sign and saying that it may be prudent to start locking some profits in. And, if you're very aggressive, the better opportunities for outsized gains, may be to the downside, especially over the short-term."
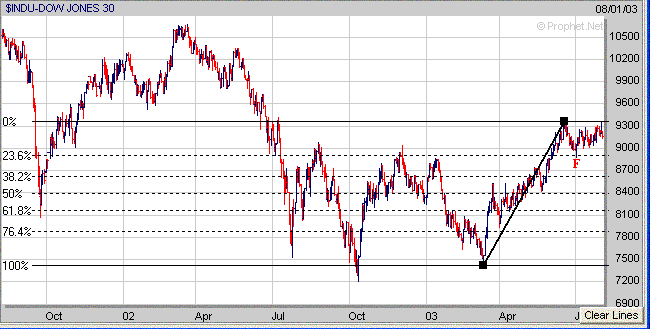
As far as the major averages the Dow still remains in a trading range between its mid June and late July highs just above 9350 and its early July low near 8875. The first support level to watch next week if the Dow remains under selling pressure is at its 50 Day EMA (blue line) near 9000.
If the Dow breaks below this level then the next area of support would be around 8875 (point F) which is its early July low and is close to its 23.6% Retracement calculated from the March low to the recent high made this past week. To the upside once again look for resistance just above the 9350 level.
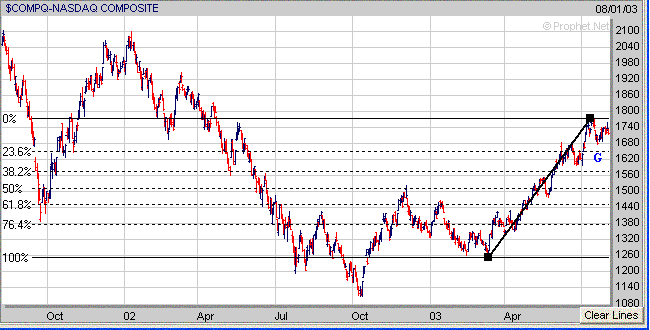
The key support level to watch in the Nasdaq next week is around 1680 which was at the top of its prior trading range before it attempted to break out in early July.
If the Nasdaq fails to hold support near 1680 then the next level of support would be at its 50 Day EMA (blue line) near 1660 which is also close to its 23.6% Retracement (point G) calculated from the March low to the early July high. To the upside look for resistance at its early July high near 1775.
As for the S&P 500 it remains in a trading range between its mid June high around 1015 and its early July low near 960. The S&P 500 closed near its 50 Day EMA (blue line) on Friday and if it fails to hold support near 980 then the next area of support would be around 960 (points H) which coincides with its early July low and 23.6% Retracement calculated from the March low to the mid June high. To the upside expect resistance near the 1015 level.
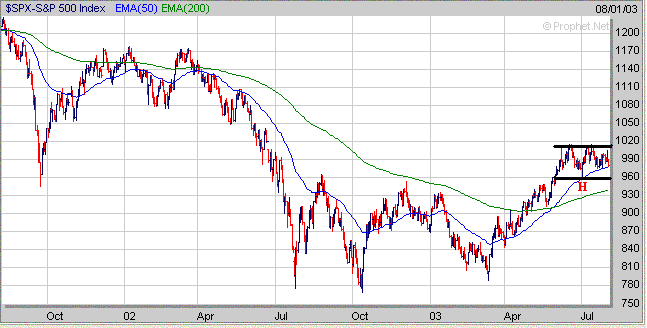
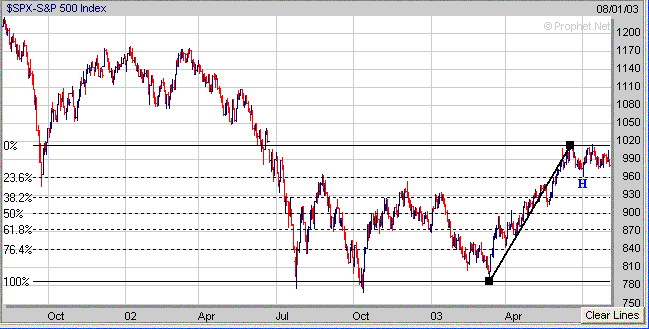
The Dow and S&P 500 are eventually going to break out of their recent trading ranges and make a substantial move in one direction or the other. The Dow gave investors a false breakout attempt on Thursday and many times the market will do a head fake before the real move is made. Thus it will be important for the Dow and S&P 500 to hold support next week at the bottom of their recent trading ranges if they continue lower and for the Nasdaq to hold support around the 1680 level.
As mentioned last weekend continue to watch the market leaders for signs of rolling over as this could spell trouble for the broader market. Both EBAY and YHOO have fallen back to their 50 Day EMA's so it will be important for them to hold support near these levels.
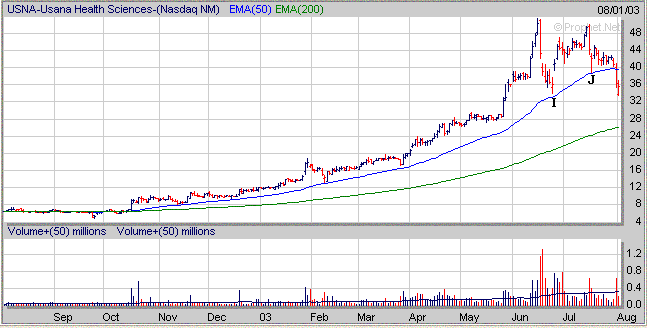
Meanwhile USNA which had been one of the best performing stocks during the past year has gotten destroyed recently. Notice how USNA held support twice (points I & J) near its 50 Day EMA (blue line) but the third time it failed which led to a significant drop this past week. This is why it will be critical for EBAY and YHOO to hold support at their 50 Day EMA's because if they don't then the same thing could happen to them.
Corrections/sell offs are a necessary evil in the market and if taken advantage of properly can be beneficial to investors. When they occur investors should not get disgusted and ignore the market as this is when you should be paying the most attention to the market. The reason is simple. When the market goes through a correction/sell off phase some stocks won't sell off as badly as others and will begin to show leadership characteristics much like we saw prior to the October 2002 lows.
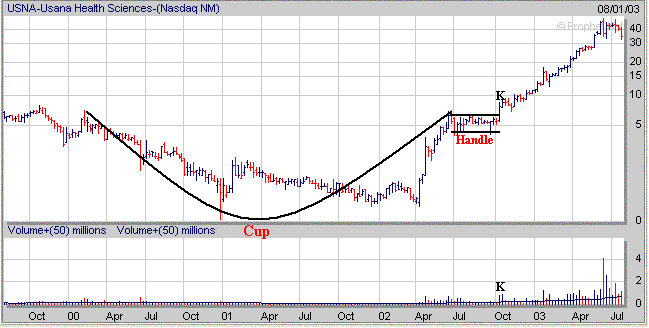
Look at USNA for example. Notice how it formed the right side of a Cup from early 2000 until the early Summer of 2002. Next from July of 2002 until September of 2002 it developed a Handle while the market was correcting in August and September. Then as the market made a bottom in October USNA broke out of its Handle on increasing volume (point K) and rose from $6 to $51 a share during the next 8 months for a gain nearly 750%.
This is why you should pay close attention to those stocks which are acting well when the market isn't as this is usually the first clue to which stocks may provide leadership in the future.
Cick
Here to Signup
for a "Free" 2 Week Trial Membership
and see which stocks are beginning to develop a favorable Chart Pattern
| ||||||