Click Here to signup for a "Free" 2 Week Trial Membership
Members have access to our Stocks to Watch List and Daily Breakout Reports
Weekend Market Analysis
(8/30/03)
Right now there is one thing to watch closely which will affect the market either in a negative or positive way as we move into September. The S&P 500 has been trading sideways between the 960 and 1015 level since mid June and once again is approaching the top of its trading range. So far it has failed three times to break above the 1015 level during the past 12 weeks. I would imagine over the next week or two the S&P 500 is either going to break above the 1015 level and make a quick move up to its longer term 38.2% Retracement Level near 1065 (calculated from the early 2000 high to the October 2002 low) or it's going to fail for the fourth time leading to a sell off and a retest of the bottom of its trading range near 960.
As for the Dow depending on what the S&P 500 does it could do one of two things. If the S&P 500 breaks out to the upside then the Dow will probably make a move up to the 10000 level which is the longer term 61.8% Retracement Level calculated from the early 2000 high to the October 2002 low. Meanwhile if the S&P 500 fails to breakout and sells off then the Dow will probably drop back to around the 9000 level which is near the longer term 38.2% Retracement Level and 20 Week EMA (purple line).
The Nasdaq still has a chance to rally up to its 200 Week EMA (blue line) near the 1915 level if the S&P 500 breaks out of its trading range to the upside. Meanwhile if the S&P 500 sells off instead then the Nasdaq could drop back to its 20 Week EMA (purple line) near 1630.
Meanwhile as I showed last weekend the Dow has been down nearly 70% of the time since 1900 during the month of September which has historically been the worst performing month by a long shot as shown by the table below.
| Monthly Performance of Dow from 1900-2002 | |||||
| Month | % of (+) | % of (-) | Average Return | Average Loss | Average Return |
| Months | Months | (+) Months | (-) Months | (1900-2002) | |
| January | 63% | 37% | 3.66% | -3.58% | 1.02% |
| February | 49% | 51% | 3.06% | -2.94% | 0.30% |
| March | 59% | 41% | 3.59% | -3.72% | 0.57% |
| April | 57% | 43% | 4.58% | -3.50% | 1.08% |
| May | 54% | 46% | 3.43% | -4.18% | -0.08% |
| June | 48% | 52% | 4.25% | -3.20% | 0.34% |
| July | 61% | 39% | 4.50% | -3.53% | 1.42% |
| August | 65% | 35% | 3.86% | -4.47% | 0.99% |
| September | 31% | 69% | 3.49% | -4.69% | -1.31% |
| October | 59% | 41% | 3.60% | -4.54% | 0.32% |
| November | 59% | 41% | 4.69% | -5.28% | 0.63% |
| December | 70% | 30% | 3.13% | -3.07% | 1.27% |
| Average Yearly Return (1900-2002) | 6.55% | ||||
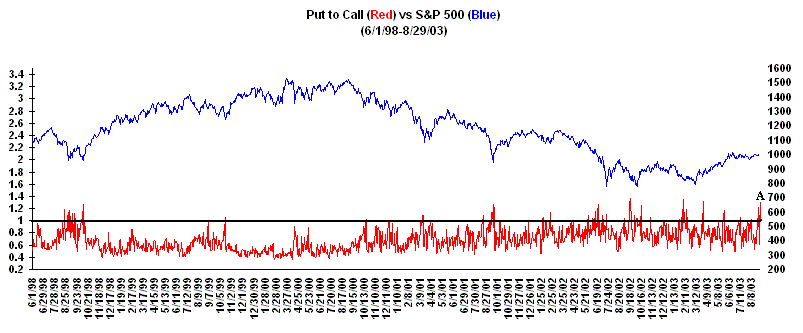
Apparently a lot of investors are hedging their bets that this year will be no different as the Put to Call Ratio shot up dramatically this past week especially on Friday (point A). Thus it appears a lot of investors believe September will end up being a down month for the market. However like anything else when everyone believes the market will go in one direction it usually ends up going the other way so it will be interesting to see what transpires during the first few weeks of September.

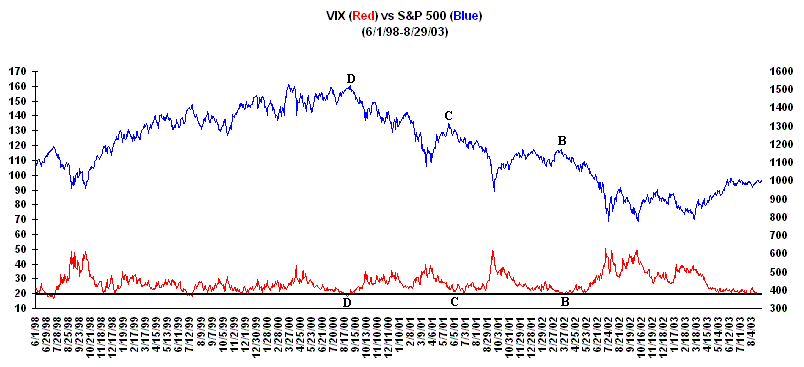
Meanwhile the Volatility Index (VIX) has continued at a rather low level for several weeks now and closed below the 20 level on Friday. The question remains can the market make another significant move upward with the VIX at this low of a level. In the past extended periods of low VIX readings have usually eventually led to a reemergence of selling pressure (points B, C and D) but maybe this time will be different.

One thing I have been noticing over the past several weeks is that there has been an increasing number of stocks developing a favorable chart pattern which could be a good sign for the market especially if the S&P 500 can break out of its trading range to the upside.
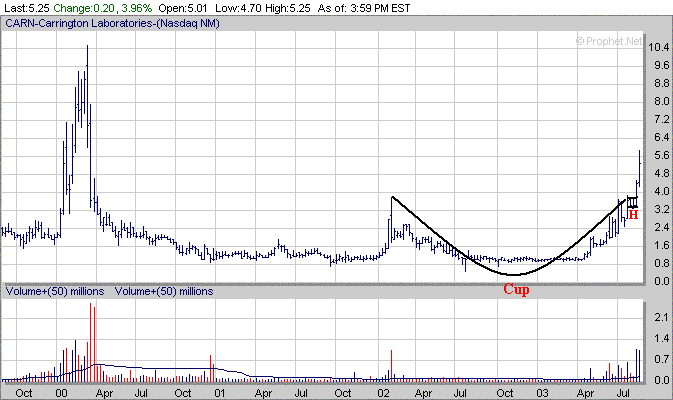
Remember one of the more Bullish looking chart patterns to look for is the "Cup and Handle" pattern. CARN which was a stock we featured in our Stocks to Watch List a few weeks ago broke out of a favorable Cup and Handle pattern just over a week ago on strong volume.

| ||||||