
Stock Market Analysis for the Dow, Nasdaq and S&P 500
(8/9/03)
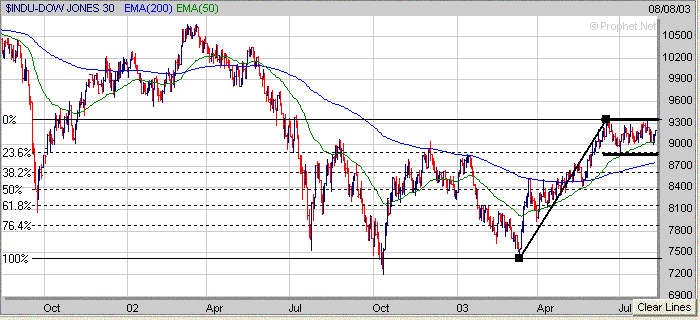
So far the Dow and S&P 500 have held support near the bottom of their longer term trading ranges which began in June. The Dow found support near its 50 Day EMA (green line) this week and was able to bounce off of it near the 9000 level. If it tries to mount a rally it will likely encounter strong resistance at the top of its trading range in the 9350 to 9400 area. Meanwhile if the recent bounce begins to weaken look for support in the 8875 to 8900 area which is near the early July low and 23.6% Retracement (dashed black line) calculated from the March low to the June high.
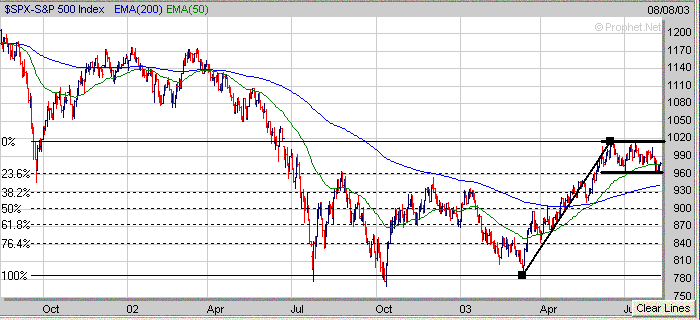
The S&P 500 was able to hold support this week at the bottom of its trading range near the 960 level which was near the early July low and 23.6% Retracement from the March low to the June high. If the S&P 500 tries to rally once again look for strong resistance at the top of its trading range near 1015. Meanwhile if the S&P 500 breaks below the 960 level then its next level of support would be in the 930 to 940 range which coincides with its 38.2% Retracement (930) from the March high to the June high and its 200 Day EMA (blue line).
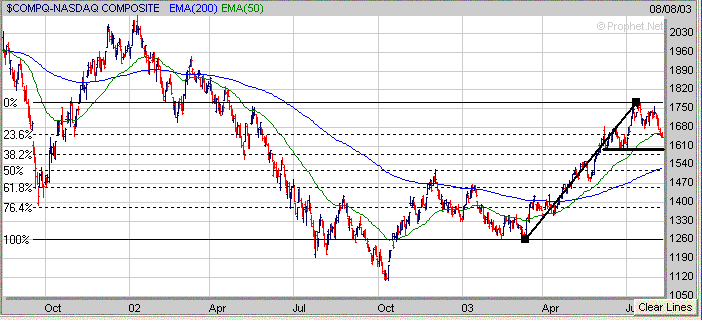
The Nasdaq has been the weakest of the three major averages of late and has dropped below its 50 Day EMA (green line) and 23.6% Retracement (dashed black line) calculated from the March low to the July high. If the Nasdaq is unable to rally from its current level the next area of support would be in the 1575 to 1600 range which coincides with its 38.2% Retracement (1575) and early June low near 1600.
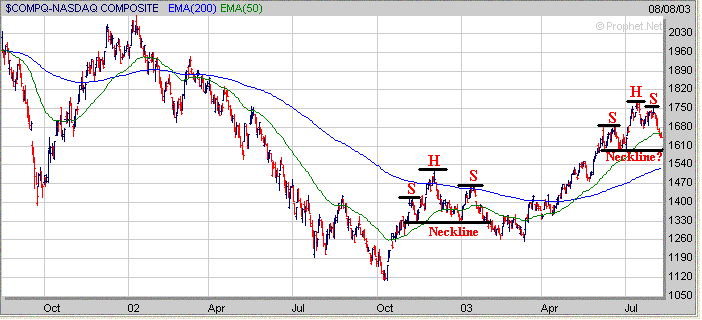
In addition I'm a little concerned that the Nasdaq could be in the developing stages of a potential Head and Shoulders Top pattern similar to what occurred in the late part of 2002 into the early part of 2003. Furthermore the 1600 level looks to be where the potential Neckline would come into play so this is why the 1600 area appears to be an important support area if the Nasdaq doesn't bounce off its current level and continues lower instead.
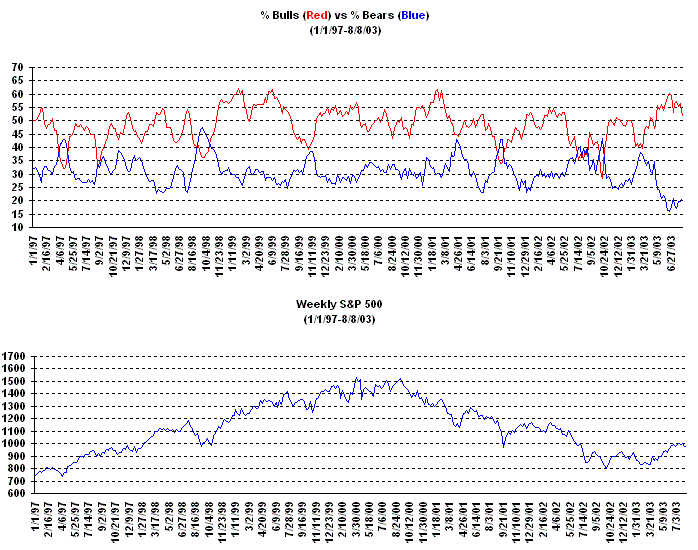
Despite the market basically trading sideways since June there hasn't been much change in investor sentiment as the % difference between the Bullish and Bearish Investment Advisors still remains quite high as shown by the chart below.
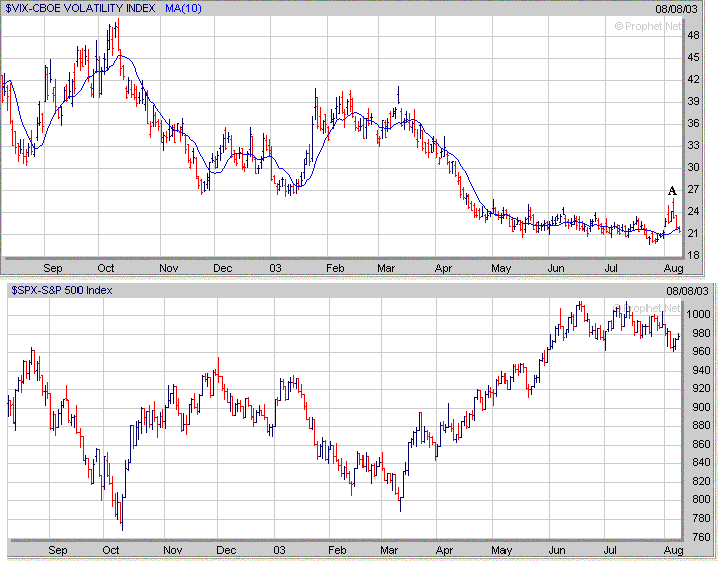
Meanwhile the Volatility Index (VIX) which tried to breakout earlier in the week got stretched away from its 10 Day Moving Average (MA) and then reversed strongly on Wednesday (point A) and is back in the lower 20's again. So I'm not sure this is a favorable sign as not much fear has been exhibited by investors yet.
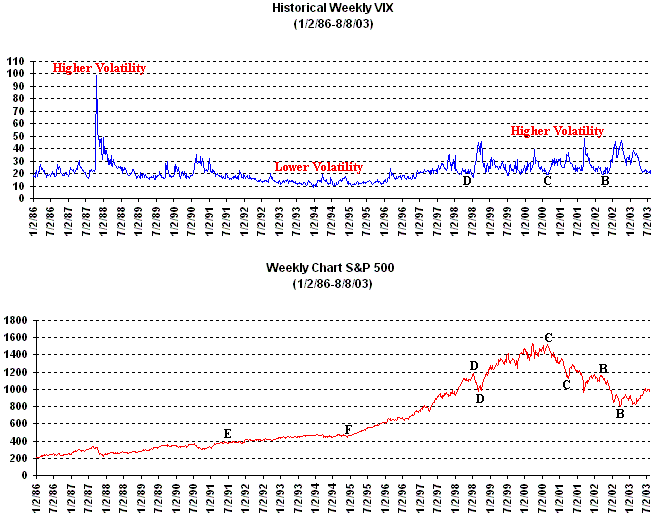
From a longer term perspective the VIX has been around since the mid 1980's and has gone through a couple of cycles. From its inception through the early 1990's it was rather volatile and then became much less volatile in the 1991 to 1995 timeframe before becoming increasing more volatile again by the late 1990's. Since the late 1990's when there has been a sustained period of low VIX readings this has been a precursor to some fairly substantial sell off's such as in the Spring of 2002 (points B), the Summer of 2000 (points C) and in the Summer of 1998 (points D). However prior to the late 1990's the VIX basically hovered in the 10 to 20 range from 1991 through 1994 and as you can see below the S&P 500 basically traded sideways for that 4 year period (points E to F) prior to starting its big run which began in 1995.
Although it's not apparent at this point what may happen to the market in the months ahead will history repeat itself with one of these two possible scenario's mentioned above coming into play.
No matter what eventually transpires in the market you have to be prepared for the next major move whether it will be to the downside or upside. Continue to look for those stocks exhibiting good Sales and Earnings that are developing a favorable chart pattern such as a "Cup and Handle, "Double Bottom" or "Flat Base".
If you don't know what these chart patterns look like you can click on this link "Favorable Chart Patterns to look for before Investing in a Stock" which gives some examples of these type of chart patterns.
Cick
Here to Signup
for a "Free" 2 Week Trial Membership
and see which stocks are beginning to develop a favorable Chart Pattern
| ||||||