|
Introductory
Special for New Members
Signup today and save 50% on our Membership Packages
which include our Stocks to Watch List and Daily Breakout Reports
Weekend Market Analysis
(10/4/03)
As I talked about last weekend I mentioned the market had become
oversold and was due for a possible bounce. I don't think anyone including
me thought the market would bounce this much this week and gain back just about
everything it had lost during the prior week.
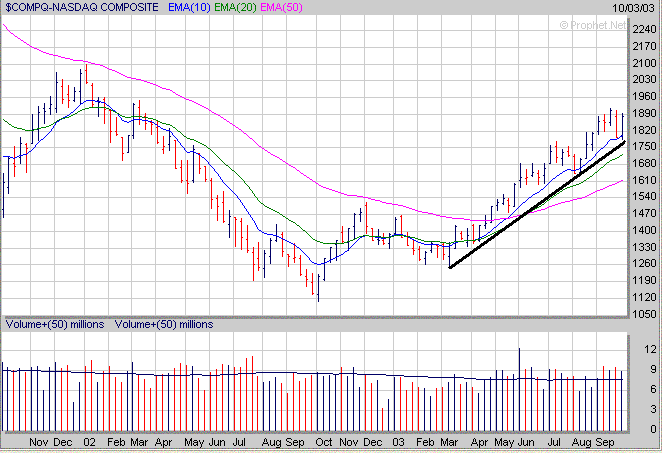
The Nasdaq found support near its 10 Weekly EMA (same as 50 Day
EMA on a daily basis) and upward sloping trend line (black line) that has it
origins back to the March low.
Furthermore on a longer term basis the Nasdaq is back near its
200 Weekly EMA (blue line) which is where it has encountered resistance at over
the past 4 weeks. The question is now will the Nasdaq be able to break
through this resistance area and rally up to its next major resistance area near
2050 which is the 23.6% Retracement Level calculated from the early 2000 high to
the October 2002 low?
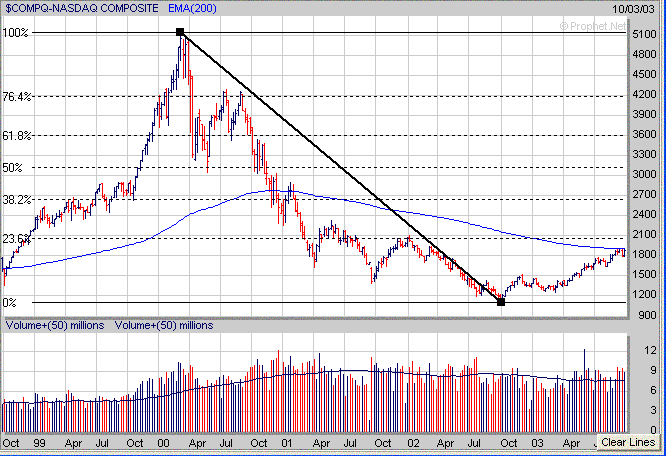
Meanwhile if the Nasdaq does stall out again near its 200 Weekly
EMA and begins to pullback again it needs to hold support at its 10 weekly EMA
(blue line) near 1810 to remain constructive in the near term.

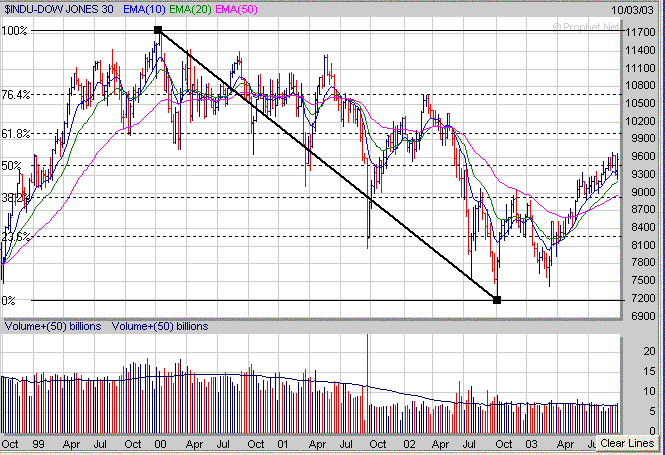
The Dow was able to hold support just above its 20 weekly EMA
(green line) earlier this week and rallied back near its previous high of just a
few weeks near 9600. If the Dow can break solidly above the 9600 level its
next major upside resistance area resides at its longer term 61.8% Retracement
Level (calculated from the early 2000 high to the October 2002 low) near 10000.
Meanwhile for the Dow to be constructive in the near term if it
begins to pull back again next week it should hold support at its 10 Weekly EMA
near 9350.
As for the S&P 500 it also found support right at its 20
Weekly EMA (green line) near 990 and then bounced strongly back up to where it
was just a few weeks ago near 940.
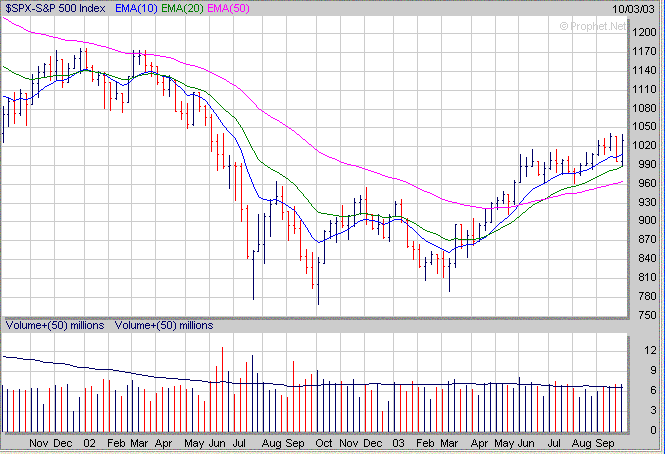
If the S&P 500 rallies above the 940 level I would expect
significant resistance to develop near the 1065 area which is where its longer
term 38.2% Retracement Level and 200 Weekly EMA have converged at.
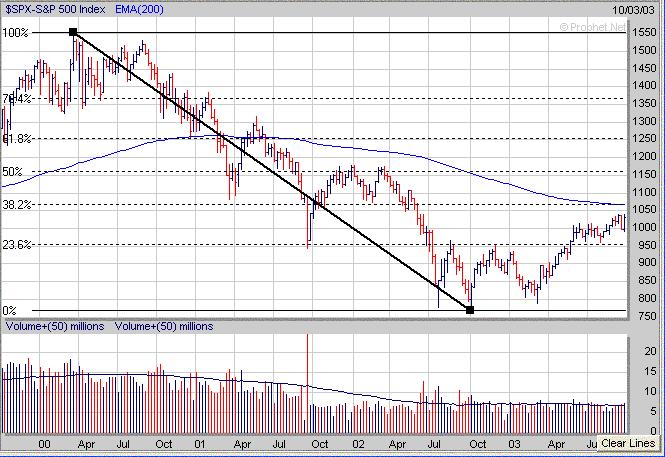
Meanwhile for the S&P 500 to remain constructive in the near
term, if it pulls back some next week, it needs to hold support at its 10 Weekly
EMA (blue line) near 1005.

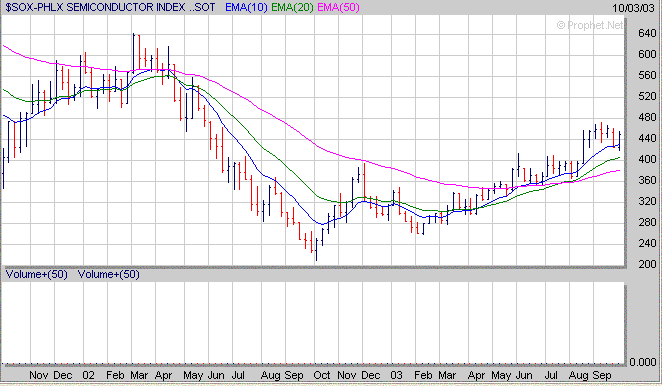
As far as some sectors to watch the Semiconductors (SOX) were
able to hold support this week just below their 10 Weekly EMA. I believe
the key thing to watch in the SOX in the upcoming weeks is whether it can break
above the 490 level which coincides with its longer term 23.6% Retracement Level
and 200 Weekly EMA (purple line). If the SOX breaks strongly above this
significant resistance area then I would expect a strong upside move back to
its 38.2% Retracement Level near 630 in the longer term.
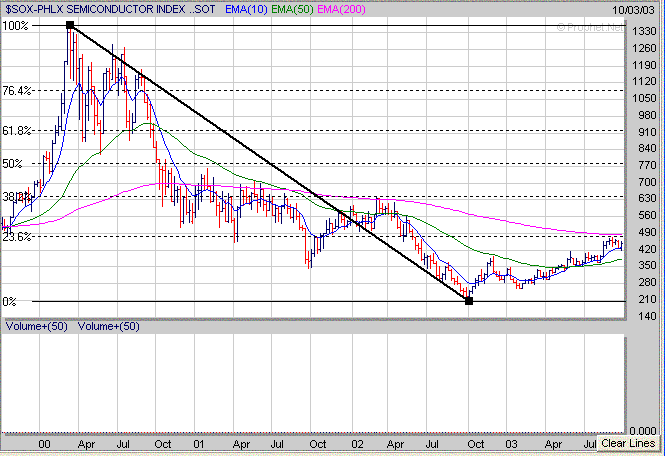
Meanwhile for the SOX to remain constructive in the near term it
will need to hold support near its 10 Weekly EMA (blue line) around 430.
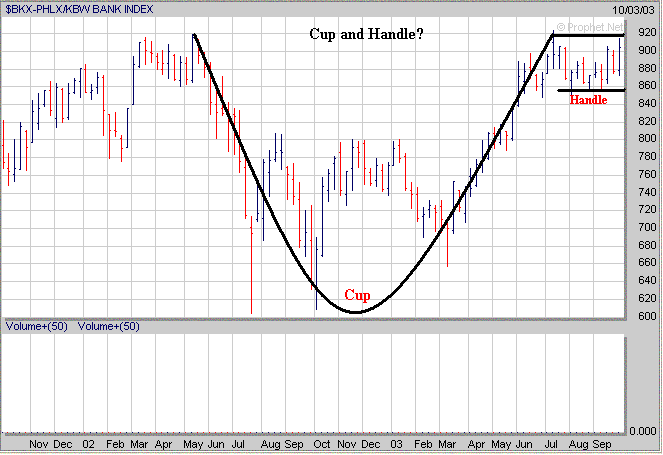
Another sector that looks interesting are the Banks (BKX) which
appear to have have developed a longer term "Cup and Handle" pattern.
The key thing to watch over the next week or two is if the BKX can break
strongly above the 925 level. Remember the Banks are strongly weighted in
the S&P 500.
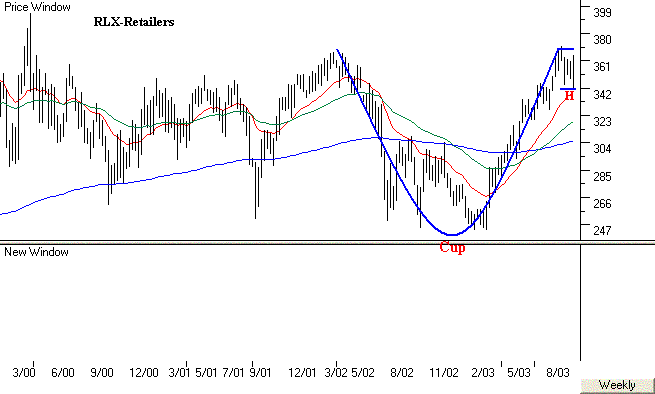
Furthermore the Retailers (RLX) also appear to be developing a
"Cup and Handle" pattern as well.
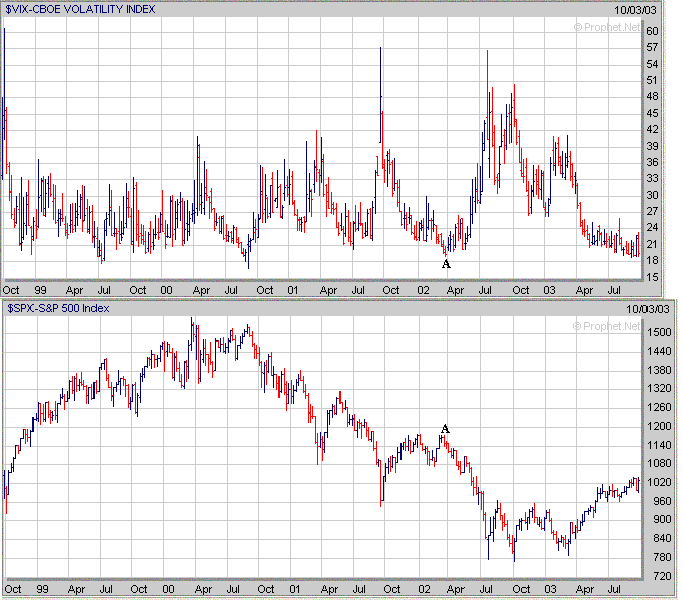
Finally looking at the Volatility Index (VIX) shows that it's
back near levels not seen since March of 2002 (point A). So far the
extremely low readings in the VIX haven't led to a significant sell off however
I'm still wary of these low levels.
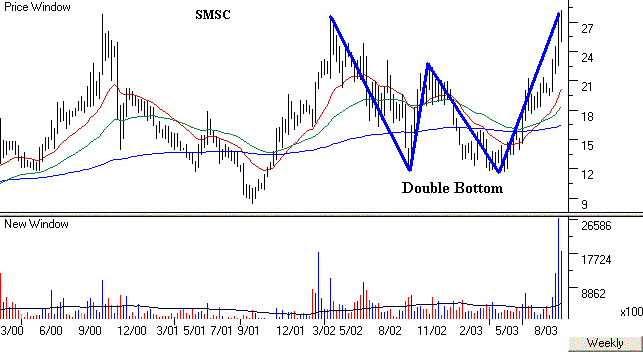
In the past I have talked about searching for those stocks which
have developed a favorable chart pattern such as the "Cup and Handle".
Another chart pattern to look for is the "Double Bottom" which looks
like the letter "W".
Here is a recent stock (SMSC) that has completed a Double Bottom
pattern over the past 18 months and now needs to develop a constructive Handle
in the weeks ahead.
Signup
Today for a "Free" Trial Membership and see our complete list of
Stocks
which are currently developing a favorable Chart Pattern such as the
Cup and Handle or Double Bottom
Amateur-Investor.net
|


