|
Introductory
Special for New Members
Signup today and save 50% on our Membership Packages
which include our Stocks to Watch List and Daily Breakout Reports
Weekend Market Analysis
(11/15/03)
Some selling pressure occurred this week in the major averages week
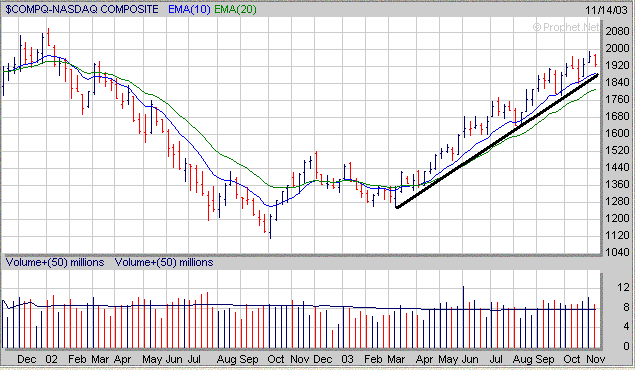
but so far the up trends from the March lows remain intact. As I have
commented on before since March the Nasdaq has been finding support near its 10
Weekly EMA (same as 50 Day EMA on a daily chart). The key level to watch
next week in the Nasdaq is around the 1880 level which is near its 10 Weekly EMA
(blue line) and also coincides with its upward sloping trend line (solid black
line) from the March low. Until this trend line is broken then the upward
trend the Nasdaq has been experiencing since the March low will remain
intact.
As
far as upside potential the Nasdaq is still below its longer term 23.6%
Retracement Level calculated from the early 2000 high to the October 2002 low
which is around the 2050 level (point A). I would imagine if the market
rallies going into the end of the year this would be a level where the Nasdaq
may encounter significant upside resistance at. 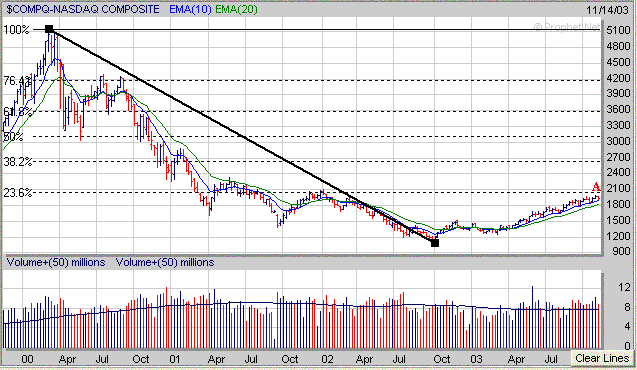
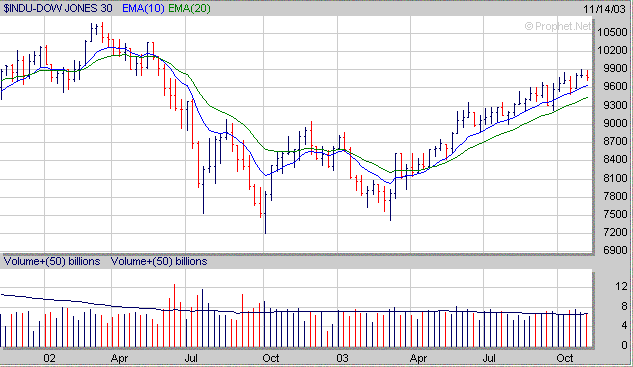
As for the Dow it has found support since last April either at
its 10 Weekly EMA (same as 50 Day EMA) or just above its 20 Weekly EMA (same as
100 Day EMA). Thus the first area of support to watch for next week in the
Dow would be just above the 9600 level (10 Weekly EMA). If the 9600 area
doesn't hold then the next major support area would be near the Dow's 20 Weekly
EMA (green line) around 9450.
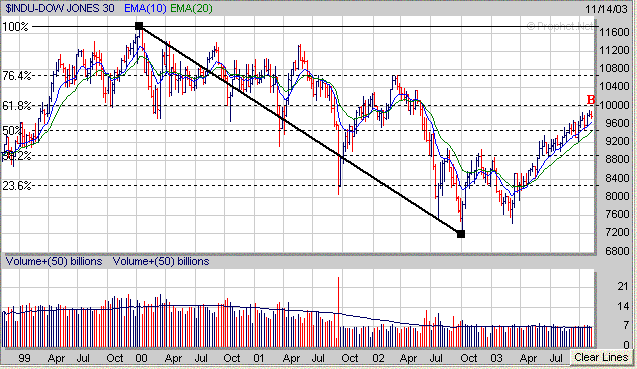
To the upside the Dow still has upside resistance at its longer
term 61.8% Retracement Level calculated from the early 2000 high to the October
2002 low near 10000 (point B). Thus if the Dow does eventually pullback
to either its 10 Weekly EMA or 20 Weekly EMA and then rallies going into the end
of the year the 10000 level may end up being a significant upside resistance
area.
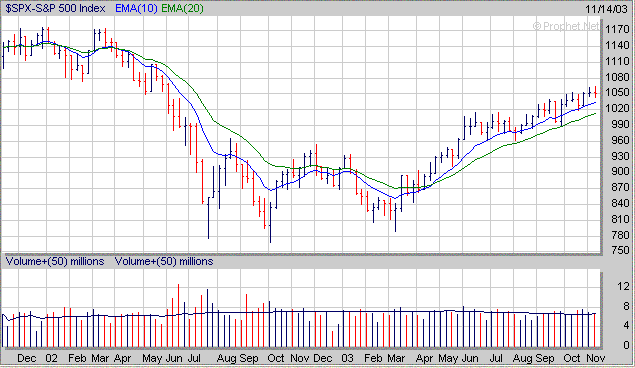
The S&P 500 just like the Dow has been finding support
either near its 10 Weekly EMA (blue line) or 20 Weekly EMA (green line) since
April as well while remaining in an up trend. Thus if the S&P 500
pulls back some next week look for initial support near 1035 (10 Weekly EMA).
If the S&P 500 fails to hold support near 1035 then the next area of support
would be around 1015 (20 Weekly EMA).
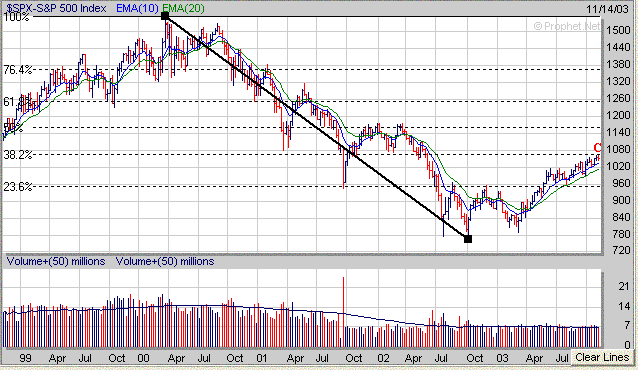
To the upside the S&P 500 has encountered resistance at its
longer term 38.2% Retracement Level just below 1065 (point C). If the
S&P 500 does pullback to its 10 Weekly EMA or 20 Weekly EMA before rallying
going into the end of the year it will be interesting to see if it can break
above this longer term resistance area.
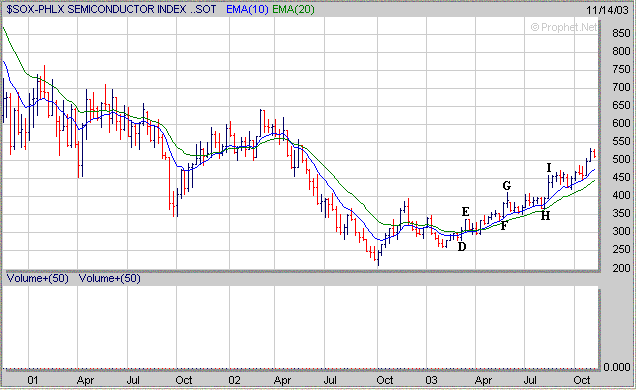
Meanwhile continue to watch the Semiconductor sector (SOX)
closely as it has been finding support near its 10 Weekly EMA or 20 Weekly EMA
since last April as well. Future strength in the market will likely hinge
on the actions in the SOX. Right now the SOX could pullback to the 475
level (10 weekly EMA) and still not be in that much trouble as long as it holds
support there and then begins to rally again. Also you may note that since
March the SOX has had a pattern of rallying strongly for 2 weeks or so (points D
to E, F to G, H to I) and then pulls back or trades sideways for awhile before
resuming its upward trend. It will be interesting to see if a similar
pattern occurs this time as well.
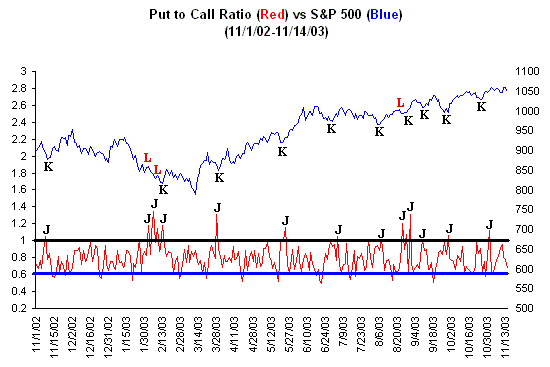
Although I haven't mentioned the Contrarian Indicators for some
time the Put to Call Ratio has been doing a fairly good job over the past year
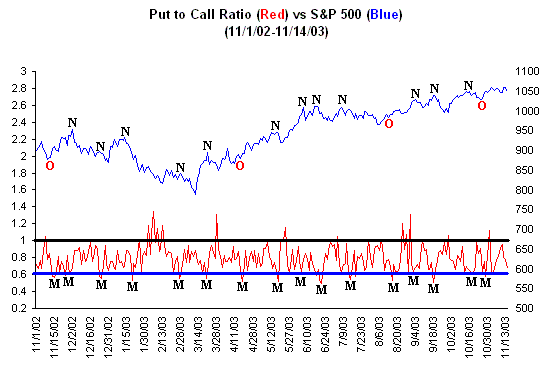
in signaling short term bottoms and tops in the market. The chart below
compares the Put to Call Ratio to the S&P 500 over the past year.
Although it hasn't been perfect extreme readings (above 1.0 or below .60) in the
Put to Call Ratio has signaled a change in direction in the S&P 500 quite
often.
Looking at the times when the Put to Call Ratio has been at or
above 1.0 during the past year (points J) has led to a bottom followed by an
upside reversal (points K) in the S&P 500 on several occasions.
However as with any indicator it's not always perfect as there were a couple of
times where the Put to Call Ratio spiked above 1.0 put the S&P 500 didn't
make a bottom (points L). But as you can see over the past year the
majority of the time when the Put to Call Ratio has risen at or above 1.0 the
S&P 500 has made a bottom and then rallied.
Meanwhile on the flip side when the Put to Call Ratio has
dropped back to .60 or below (points M) the S&P 500 has generally made a top
(points N) followed by some type of sell off. Now there were a few cases
where a top didn't occur when the Put to Call Ratio dropped below .60 (points O)
but generally it has worked over the past year or so.
At any rate keep an eye on the Put to Call Ratio in the weeks
ahead and watch for any significant drop to around .60 or rise above 1.0 to
signal a potential reversal in the market.
If the market does attempt to rally into the end of the year now
is a good time to start noticing which stocks are developing a favorable chart
pattern. A stock in the Semiconductor sector which has formed the right
side of a "Cup" over the past 20 months is OIIM. What you want to
watch for over the next few weeks is for OIIM to develop a "Handle" to
go along with its "Cup" to complete a proper "Cup and
Handle" pattern before making another move higher. 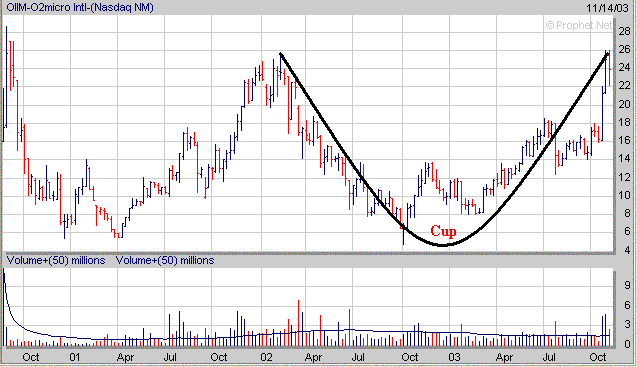
Signup
Today for a "Free" Trial Membership and see our complete list of
Stocks
which are currently developing a favorable Chart Pattern such as the
Cup and Handle or Double Bottom
Amateur-Investor.net
|


