|
Introductory
Special for New Members
Signup today and save 50% on our Membership Packages
which include our Stocks to Watch List and Daily Breakout Reports
Weekend Market Analysis
(11/1/03)
Although the major averages (Dow, Nasdaq and S&P 500) rallied this week
there is one thing to keep an eye on over the next few weeks. All three
major averages appear to be exhibiting a potential small Double Top pattern. A
similar pattern occurred in the S&P 500 back in June and July as it formed a
Double Top pattern and underwent some selling pressure but found support at the
960 level before eventually trending higher. At this time it appears a
similar Double Top pattern maybe developing although on a smaller scale.
If some selling pressure does develop it looks like the key support area to the
downside would be around the 1020 area. 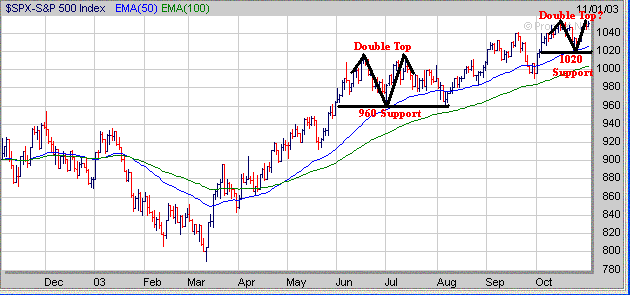
A similar potential Double Top pattern also
appears in the Dow and if some selling pressure develops the key downside
support area appears to be around 9500. 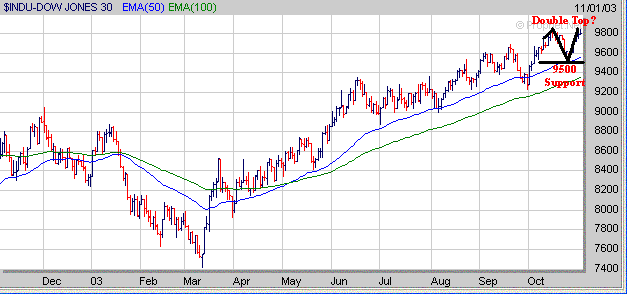
The Nasdaq is also showing a similar
pattern and if some selling pressure develops its key downside support area
appears to be near 1850. 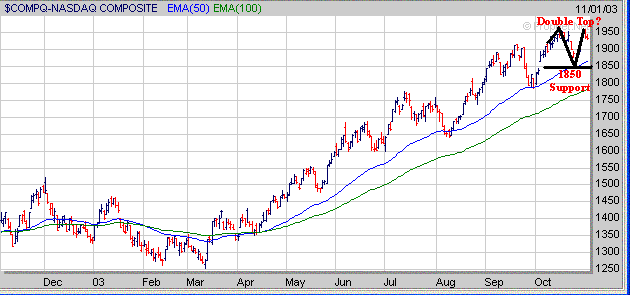
Meanwhile the Volatility Index (VIX)
is now at a level not seen since the early part of 1998 (point A). As you
can see below when the VIX has been well below 20 like it is now in 3 out of the
4 cases this has led to some type of top followed by a sell off (points B, C and
D). However as mentioned last weekend there was one occurrence when a very
low reading in the VIX didn't lead to a substantial sell off which was back in
early 1998 (point A). In this case the S&P basically traded sideways
for several weeks (point E) before making one more move higher (1120 to
1200). Thus it will be interesting to see which scenario plays out this
time around. 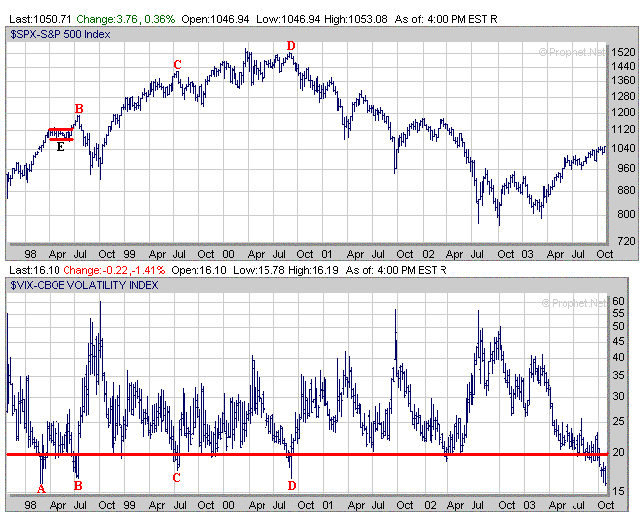
If the potential Double Top patterns
fail to materialize and the major averages continue higher next week once again
I would look for upside resistance at their longer term Retracement Levels
calculated from the early 2000 highs to the October 2002 lows. In
the Dow the level to watch would be near 10000 which is the longer term 61.8%
Retracement Level. 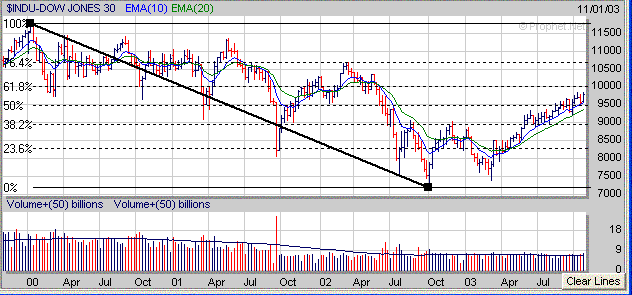 As
for the Nasdaq look for upside resistance near the 2050 area which is its longer
term 23.6% Retracement Level. 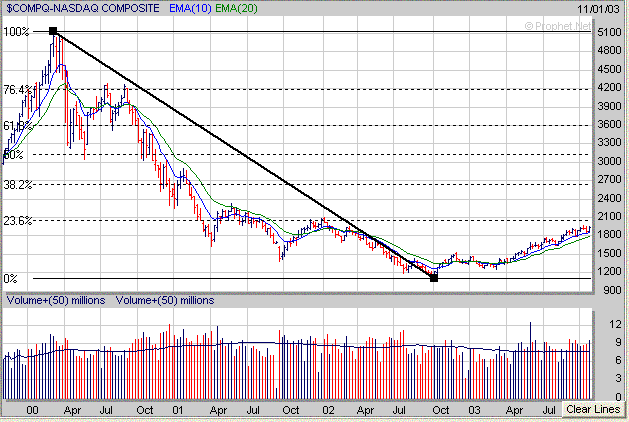
In
the S&P 500 look for upside resistance near the 1065 area which is its
longer term 38.2% Retracement Level. 
Finally
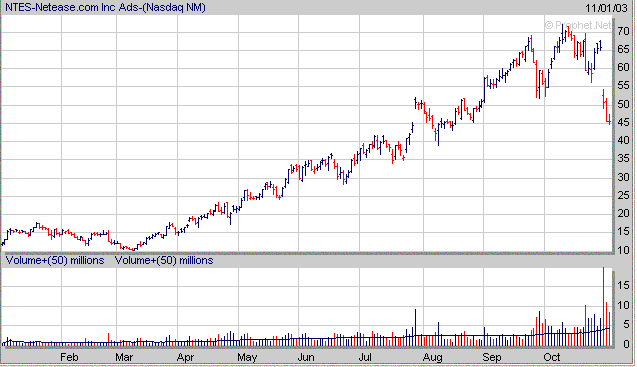
some of the stocks which have been leading the market higher over the past
several months have begun to breakdown accompanied by strong volume.
Some recent examples include AAI, JCOM and NTES. 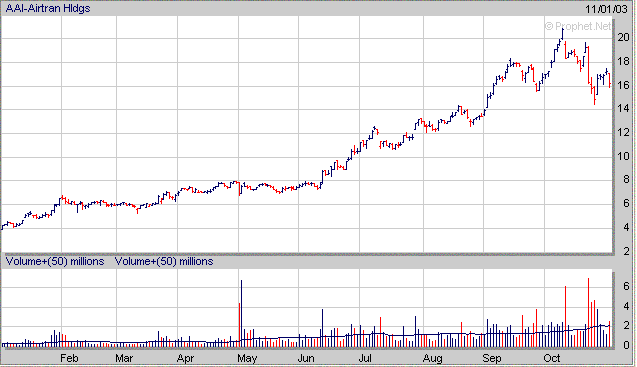
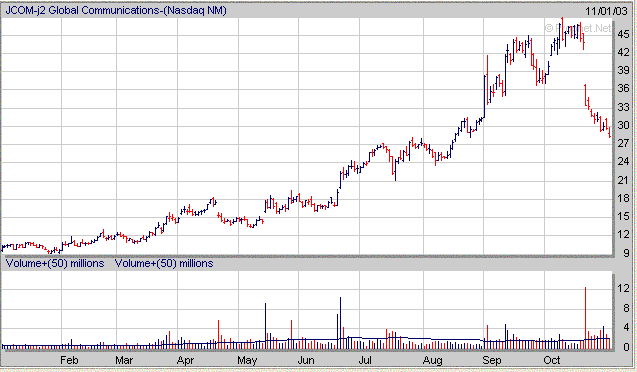
Now
this can mean one of two things. Either the market is nearing a top and
potential sell off or the Institutional Money is moving their money into other
sectors. If the Institutional Money is moving their money into other
sectors then you have to notice which stocks are holding up well and forming a
favorable chart pattern. One such example is NITE which has developed a small
3 week Handle (H) after forming the right side of a 2 year Cup. What I
will be watching for over the next few weeks is for NITE to break out of its
Handle and above its Pivot Point which is near $14.50 accompanied by strong
volume. 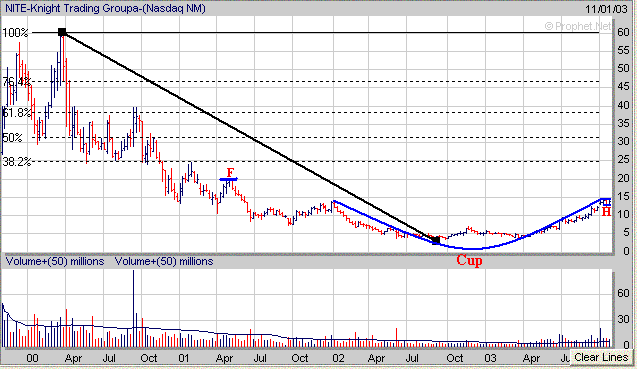
If by chance NITE does eventually breakout to the upside in the weeks
ahead then you have to determine where it may rise too. In the case of
NITE you can look at its longer term Retracement Levels and previous areas where
it has stalled out at in the past. When I look at NITE I see two potential
levels where it may run into longer term resistance if it does eventually
breakout to the upside. The first area would be at the $20 level which is
where it encountered resistance at in the Spring of 2001 (point F).
Meanwhile if NITE is able to rise above the $20 level then the second area of
upside resistance would probably reside at its longer term 38.2% Retracement
Level near $25. Thus this gives me an idea of what levels I may consider
selling NITE at if it does follow through to the upside after breaking
out.
Signup
Today for a "Free" Trial Membership and see our complete list of
Stocks
which are currently developing a favorable Chart Pattern such as the
Cup and Handle or Double Bottom
Amateur-Investor.net
|


