|
Introductory
Special for the Holiday's
Signup today and save 50% on our Membership Packages
which include our Stocks to Watch List and Daily Breakout Reports
Weekend Stock Market Analysis
(11/22/03)
So far the major averages (Dow, Nasdaq and S&P 500) have
held support near their respective 10 Weekly EMA's (same as 50 Day EMA on a
daily basis). It appears there are two possible scenario's for the shorter
term. The first scenario would be for the major averages to hold support
near their current levels and then stage another rally as we move into the end
of November and into the month of December. The second scenario would be
for the major averages not to hold support at their current levels which would
lead to a drop back to their 20 Weekly EMA's (same as 100 Day EMA on a daily
basis). Looking at the Dow and applying the two scenario's
mentioned above if it's unable to hold support near its 10 Weekly EMA (blue
line) and comes under more selling pressure the next support area would be at
its 20 Weekly EMA (green line) near 9450. Also notice since April the
Dow has been able to hold support near its 20 Weekly EMA so this is a key level
that needs to hold if the Dow's longer term up trend is going to remain intact. 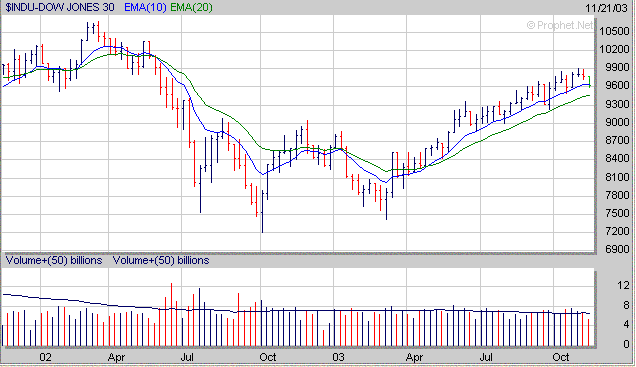
Meanwhile
if the Dow is able to hold support near its 10 Weekly EMA (blue line) and begins
to rally then a rise back to its previous high a few weeks ago near 9900 is
possible. In the longer term the Dow still has a significant upside
resistance area at its 61.8% Retracement Level near 10000 calculated from the
early 2000 high to the October 2002 low. 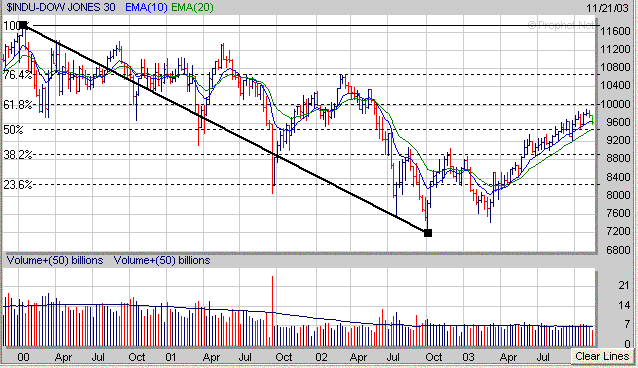
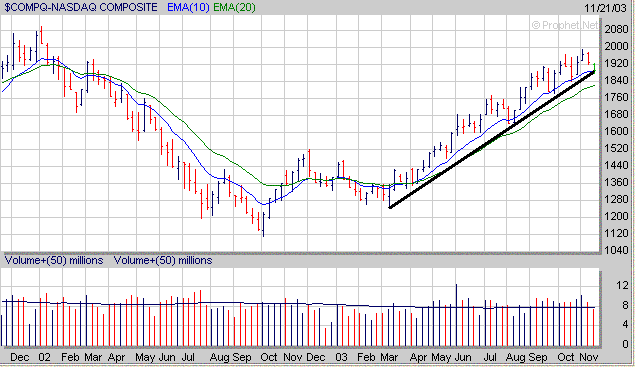
The
Nasdaq has been able to hold support around 1880 which is near its 10 Weekly EMA
(blue) and also coincides with its longer term upward sloping trend line (black
line) originating from the March low. If the Nasdaq is unable to hold
support near 1880 then its next area of support appears to be at its 20 Weekly
EMA (green line) near 1825.
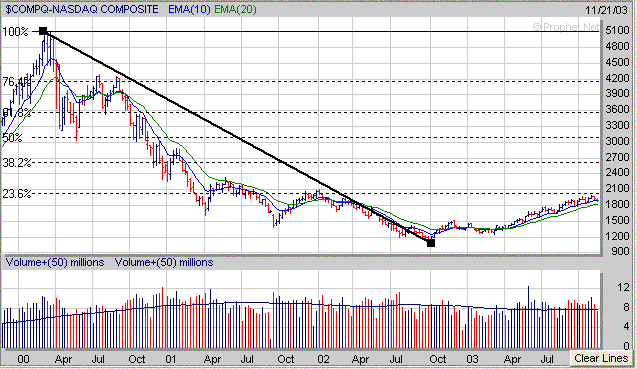
Meanwhile if the Nasdaq is able to hold support near the 1880
level and then attempts to rally there are two upside areas of resistance it
could encounter. The first resistance level would be its previous high
made a few weeks ago near 1990 while a second area of stronger resistance would
reside around the 2050 level which is the 23.6% Retracement Level calculated
from the early 2000 high to the October 2002 low.
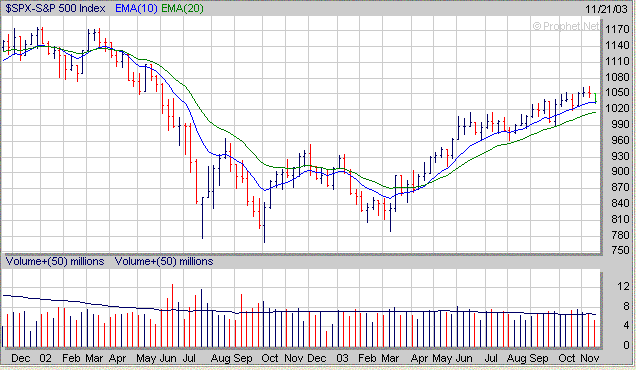
The S&P 500 also closed near its 10 Weekly EMA (blue line)
on Friday. If the S&P 500 is unable to hold support near its 10 Weekly
EMA then the next area of support to the downside would be at its 20 Weekly EMA
(green line) near 1015. As you can see since last April the S&P 500
hasn't dropped below its 20 Weekly EMA so this is an important support area that
needs to hold so that S&P 500's up trend from the March low remains intact.
Meanwhile if the S&P 500 is able to hold support near its 10
Weekly EMA and begins to rally there is a significant upside resistance area
around the 1065 level which is where the S&P 500 stalled out at a few weeks
ago. The 1065 area is the S&P 500's longer term 38.2% Retracement
Level calculated from the early 2000 high to the October 2002 low. 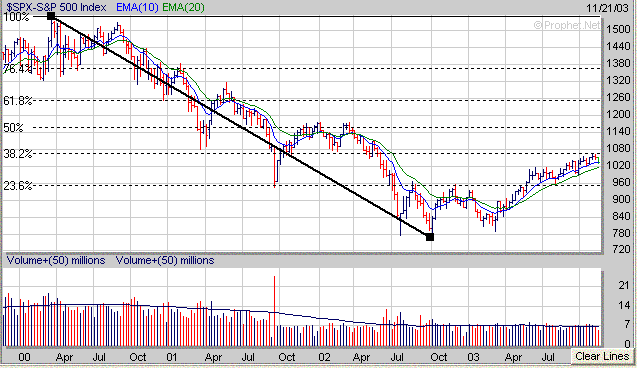
As
mentioned last weekend over the past year or so the Put to Call Ratio has done a
fairly good job of signaling short term bottoms and tops. When the Put to
Call has risen to a value of 1.0 or above this has been a signal of a nearing
bottom (points B) and when the Put to Call Ratio has dropped to .60 or below
this has been a signal of a nearing top. Now this doesn't mean it has been
right 100% of the time during the past year but it has been pretty
accurate. Despite the weakness in the market this past week the Put to
Call Ratio didn't rise much and is still below 1.0. I would be more
confident of a nearing bottom in the market if the Put to Call Ratio would have
risen more substantially this week. 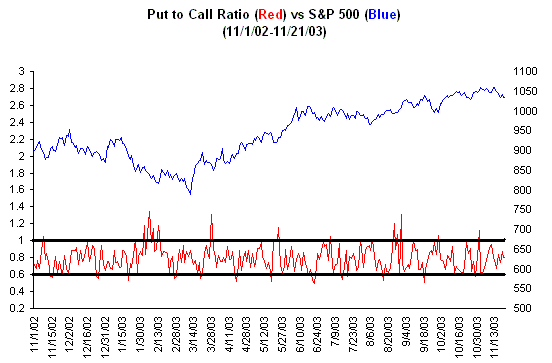
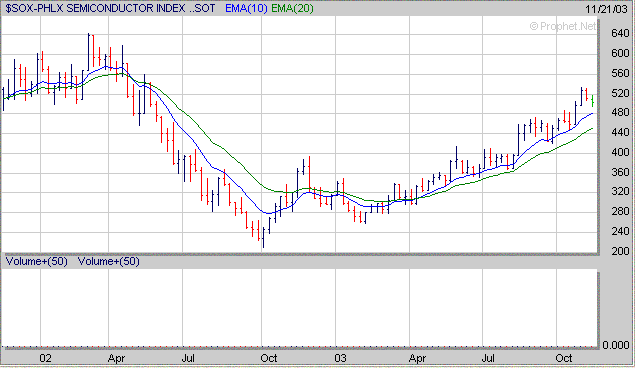
As
far as a few sectors to watch the Semiconductors (SOX) are still above their 10
Weekly EMA (blue line) and despite pulling back over the past two weeks still
look to be in good shape unless they break below their 10 Weekly EMA near
480. 
Meanwhile
for those of you that are tracking the Gold sector (XAU) it made another nice
move upward this past week. However I would expect the XAU to run into
substantial upside resistance as it nears the 112 level which is its longer term
61.8% Retracement Level calculated from the early 1996 high to the late 2000
low. Also you may note that the XAU went from the early 40's in late 2000
(point C) to the mid 80s by the early part of 2002 (point D) for a gain of
around 100%. If the XAU does rally up to the 112 level (point F) this
would lead to another 100% gain from the low made in the middle part of 2002
which was in the mid 50's (point E). If history repeats itself again once
the XAU reaches the 112 level there may be a sharp sell off much like
occurred in the middle part of 2002 (points D to E). 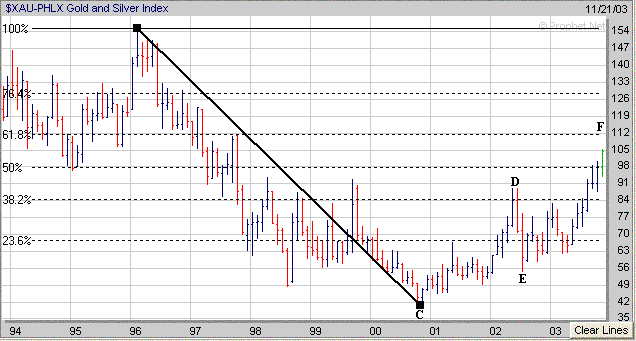
Despite the weakness in the market over the past few weeks
there continues to be some stocks setting up favorably if the market does decide
to move higher. Last week I mentioned OIIM in the Semiconductor sector as
a stock which had formed the right side of a "Cup" but needed to
develop a "Handle". So far OIIM has held up well and is
beginning to develop a very small 2 week "Handle" (H) as it remains in
a trading range between $22 and $26. Want I would like to see over the
next few weeks is for OIIM to continue to remain in its trading range between
$22 and $26 while working on its "Handle". 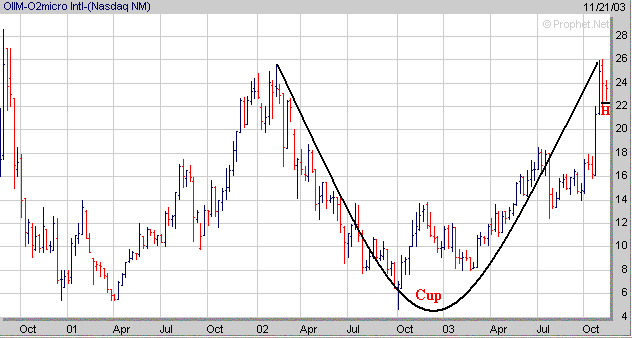
How can a Premium Membership to amateur-investor.net
benefit you as an investor? I use principles derived from "CANSLIM"
to search for stocks to put in my Top 100 List which are then ranked on
several factors including EPS Rank, RS Rank, Group Strength,
Accumulation/Distribution, Net Profit Margins and etc. From my Top 100
List I then narrow the list down further by featuring those stocks which
have developed a favorable chart pattern such as a "Cup and Handle",
"Double Bottom" or "Flat Base". These stocks are then
included in my "Stocks to Watch List" which gives investors a
quick reference to those stocks which may provide the best buying opportunities
over in the weeks ahead. Each stock in my "Stocks to Watch List"
includes specific Buy Prices, Stop Loss Prices (very important) and projected
Target Prices.
Signup
Today for a "Free" Trial Membership and see our complete list of
Stocks
which are currently developing a favorable Chart Pattern such as the
Cup and Handle or Double Bottom
Amateur-Investor.net
|


