|
Introductory
Special for the Holiday's
Signup today and save 50% on our Membership Packages
which include our Stocks to Watch List and Daily Breakout Reports
Weekend Stock Market Analysis
(11/29/03)
Although the major averages were up last week it's difficult to
put much significance in the move since the market was only open for 3 1/2
trading days. Next week will be much more significant as the market
returns to a normal trading schedule. The question is at this point will
the month of December follow its historical pattern since 1900 which is
finishing higher nearly 70% of the time as shown by the table below. In
addition December has had the second highest Average Monthly Return (+1.27%) for
the Dow based on statistics since 1900.
| Monthly Performance of Dow from 1900-2002 |
| Month |
% of (+) |
% of (-) |
Average Return |
Average Loss |
Average Return |
|
Months |
Months |
(+) Months |
(-) Months |
(1900-2002) |
| January |
63% |
37% |
3.66% |
-3.58% |
1.02% |
| February |
49% |
51% |
3.06% |
-2.94% |
0.30% |
| March |
59% |
41% |
3.59% |
-3.72% |
0.57% |
| April |
57% |
43% |
4.58% |
-3.50% |
1.08% |
| May |
54% |
46% |
3.43% |
-4.18% |
-0.08% |
| June |
48% |
52% |
4.25% |
-3.20% |
0.34% |
| July |
61% |
39% |
4.50% |
-3.53% |
1.42% |
| August |
65% |
35% |
3.86% |
-4.47% |
0.99% |
| September |
41% |
69% |
3.49% |
-4.69% |
-1.31% |
| October |
59% |
41% |
3.60% |
-4.54% |
0.32% |
| November |
59% |
41% |
4.69% |
-5.28% |
0.63% |
| December |
70% |
30% |
3.13% |
-3.07% |
1.27% |
| Average
Yearly Return (1900-2002) |
6.55% |
As far as the major averages the Dow held support near its 10
Weekly EMA (same as 50 Day EMA on a daily basis) around the 9600 level and then
rallied. To the upside the Dow still has a significant longer term
resistance area around the 10000 level which is the 61.8% Retracement from the
early 2000 high to the October 2002 low. During the month of December it
will be interesting to see if the Dow can break above this level.
Meanwhile if the Dow is unable to break above the 10000 level during the month
of December and falters there are two areas of support to watch. The first
area is at the Dow's 10 Weekly EMA near 9600 while the second area resides at
its 20 Weekly EMA near the 9500 level. As I have pointed out before since
last April the Dow hasn't dropped below its 20 Weekly EMA (green line) while
trending higher. 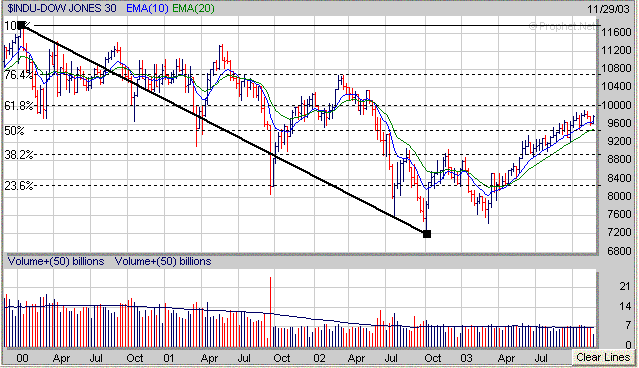
The
Nasdaq also has found support at its 10 Weekly EMA (blue line) and if it
continues higher in the month of December look for upside resistance at its long
term 23.6% Retracement Level near 2050. The 2050 area also is near the
high the Nasdaq made in the early part of 2002 (point A). Meanwhile if the
Nasdaq falters look for support either near its 10 Weekly EMA around 1880 or at
its 20 Weekly EMA (green line) near 1825. 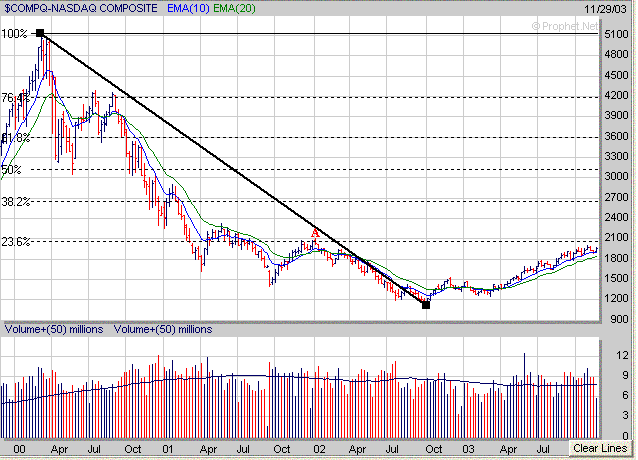
The S&P 500 just like the Dow
and Nasdaq also has recently found support near its 10 Weekly EMA (blue line)
around the 1035 area. The big question for the S&P 500 is will it be
able to rally above its longer term resistance area near 1065 allowing for a
more substantial move upward. If the S&P 500 can break above the 1065
area on strong volume then its next major area of upside resistance appears to
be around the 1155 level which coincides with its long term 50% Retracement
Level and high made in 2002 (point B). Meanwhile if the S&P 500 is
unable to break above the 1065 area and falters look for support either at its
10 Weekly EMA near 1035 or at its 20 Weekly EMA (green line) near 1020. As
with the Dow the S&P 500 hasn't dropped below its 20 Weekly EMA either since
last April while remaining in its upward trend. 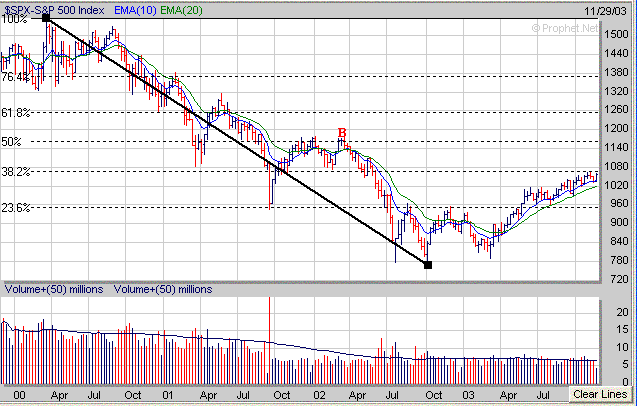
One key sector to watch is the
Semiconductors (SOX). Any additional upside movement in the market will
likely depend on what the SOX does in the weeks ahead. So far the SOX has
held support just above its 10 Weekly EMA (blue line). If it can break
solidly above the 540 level accompanied by good volume it could eventually rally up to the
630-640 level which is its longer term 38.2% Retracement Level and also
coincides with its high made in 2002 (point C). 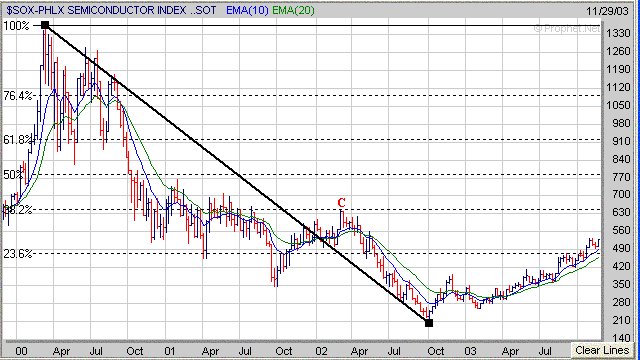
Meanwhile for those of you that
track the Gold sector (XAU) know that it has been performing strongly for
several months. However I will caution you that the XAU is approaching its
longer term 61.8% Retracement Level near 112 (calculated from the 1996 high to
the late 2000 low). Thus the XAU could potentially stall out near this
level and undergo some profit taking. 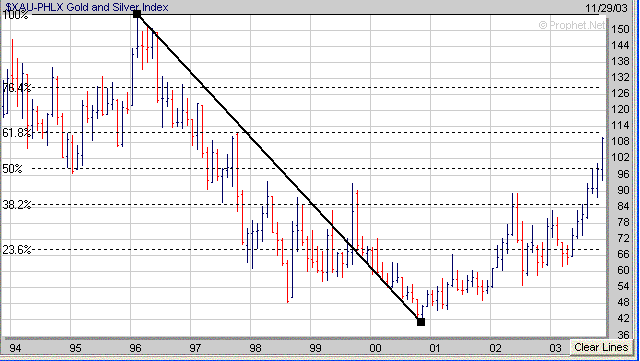
How can a Premium Membership to amateur-investor.net
benefit you as an investor? I use principles derived from "CANSLIM"
to search for stocks to put in my Top 100 List which are then ranked on
several factors including EPS Rank, RS Rank, Group Strength,
Accumulation/Distribution, Net Profit Margins and etc. From my Top 100
List I then narrow the list down further by featuring those stocks which
have developed a favorable chart pattern such as a "Cup and Handle",
"Double Bottom" or "Flat Base". These stocks are then
included in my "Stocks to Watch List" which gives investors a
quick reference to those stocks which may provide the best buying opportunities
over in the weeks ahead. Each stock in my "Stocks to Watch List"
includes specific Buy Prices, Stop Loss Prices (very important) and projected
Target Prices. As mentioned over the past few weeks OIIM in the
Semiconductor sector (SOX) has been developing an O'Neil "Cup and
Handle" pattern. If the SOX makes a strong move upward during the
month of December OIIM will certainly be one to watch if it can break above the
$26 level accompanied by good volume. 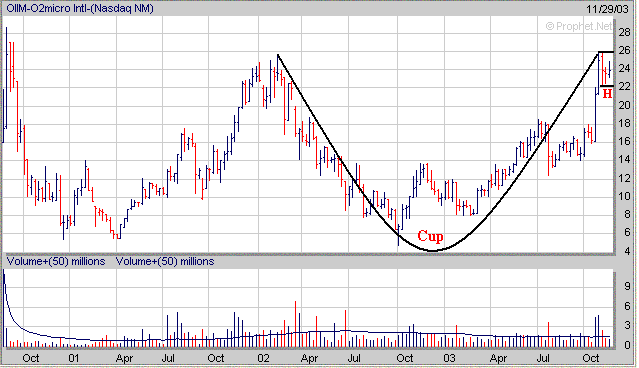
Signup
Today for a "Free" Trial Membership and see our complete list of
Stocks
which are currently developing a favorable Chart Pattern such as the
"Cup and Handle" or "Double Bottom"
Amateur-Investor.net
|


