|
Introductory
Special for New Members
Signup today and save 50% on our Membership Packages
which include our Stocks to Watch List and Daily Breakout Reports
Weekend Market Analysis
(11/8/03)
Near Term Looking at the major
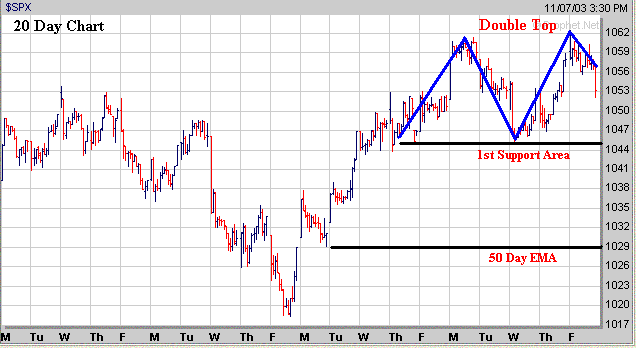
averages on a short term basis over the past 20 trading days shows both the Dow
and S&P 500 have made a potential Double Top in the near term after running
up strongly during the last week of October. The key levels to watch early
next week in the Dow and S&P 500 are near 9775 (Dow) and 1045 (S&P
500). If these levels don't hold then the next area of support would be at
their 50 Day EMA's which are currently near 9600 (Dow) and 1030 (S&P 500). 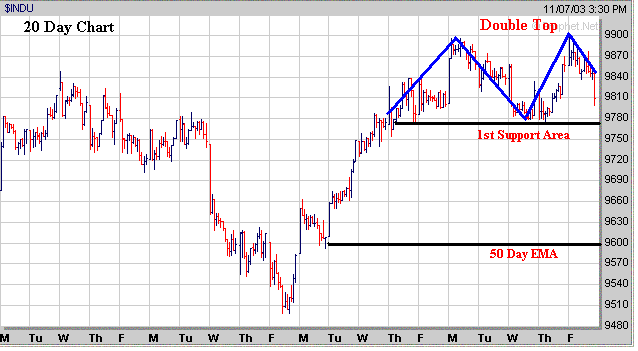
As far as the Nasdaq it has gained
nearly 145 points over the past 10 trading since making a short term bottom on
October 24th. It wouldn't be surprising to see some short term weakness
develop next week due to this quick run up. The first short term support
level to watch would be the 23.6% Retracement from the low made on October 24th
to the high made on Friday which is near 1955 (point A). If this level
doesn't hold then the next short term support area would be at the 38.2%
Retracement near 1935 (point B). So those will be some key short term
support areas to watch next week if we see some selling pressure develops. 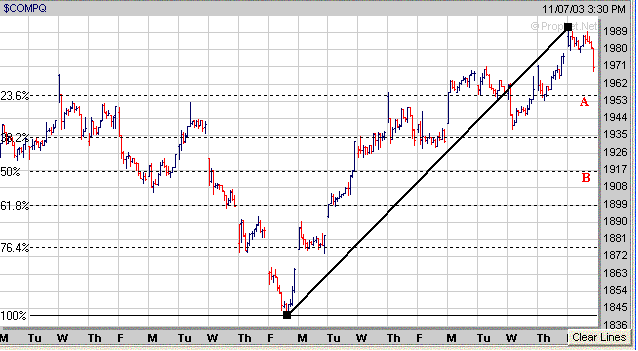
Longer term In
the longer term the major averages continue to maintain their upward trends
which began in March and have been holding support near their 10 Weekly EMA
(same as 50 Day EMA) or 20 Weekly EMA (same as 100 Day EMA) on every attempted
sell off. As long as the major averages continue to find support near
these EMA's the up trend will remain intact. To the upside the
Dow still has a significant area of resistance around the 10000 level (point C)
which is its longer term 61.8% Retracement Level calculated from the early 2000
high to the October 2002 low. The key support areas to the downside are at
the 9600 level (10 Weekly EMA) and around 9400 (20 Weekly EMA). 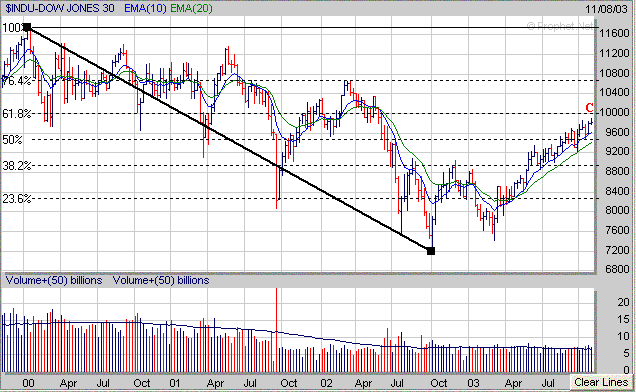
The Nasdaq has a significant
area of upside resistance around 2050 level which is its longer term 23.6%
Retracement Level calculated from the early 2000 high to the October 2002
low. Meanwhile the key support area to the downside is at its 10 Weekly
EMA near 1885. 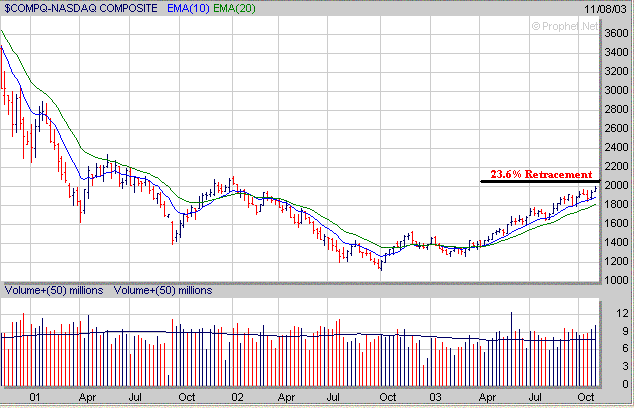
The S&P 500 has rallied up
to its longer term 38.2% Retracement Level near 1065 (point D) which may provide
some resistance in the short term. If the S&P 500 eventually takes out
the 1065 level its next significant area of upside resistance resides at its
longer term 50% Retracement Level near 1155 (point E). To the downside the
key support areas to watch are at the S&P 500's 10 Weekly EMA near 1030 or
at its 20 Weekly EMA near 1010. 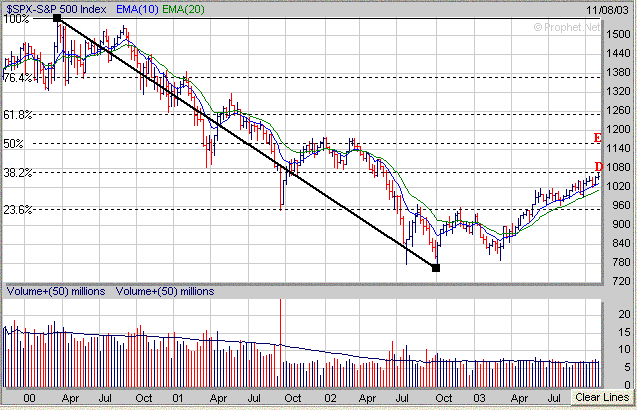
Meanwhile some of you have asked me
to comment about the Gold sector (XAU). The XAU has run into some longer
term resistance at its 50% Retracement Level calculated from the 1996 high to
the late 2000 low. If the XAU rises above 100 level then it should rally
up to the 112 area which is its longer term 61.8% Retracement Level. 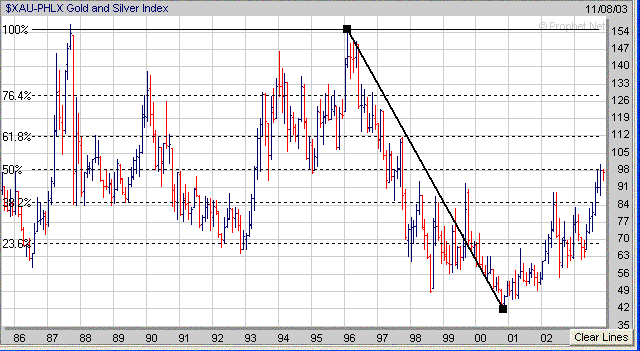
Finally
continue to focus on those stocks which are breaking out of a favorable chart
pattern accompanied by good volume. TRMM which we featured back in
September has nearly doubled in price after breaking out of a "Cup and
Handle" pattern in early October. 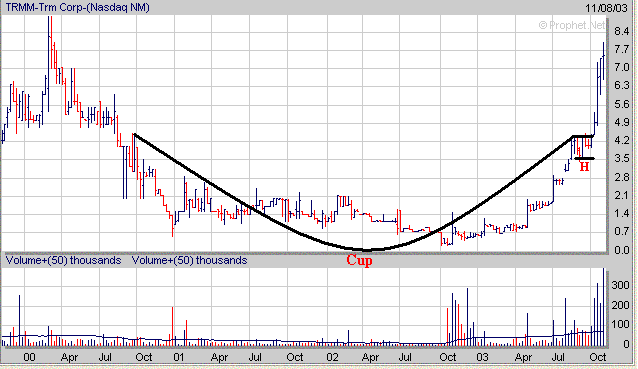
Signup
Today for a "Free" Trial Membership and see our complete list of
Stocks
which are currently developing a favorable Chart Pattern such as the
Cup and Handle or Double Bottom
Amateur-Investor.net
|


