|
Our
Introductory Holiday Special will expire on January 1st
Signup today and save 50% on all our Membership Packages
which include our Stocks to Watch List and Daily Breakout Reports
Weekend Stock Market Analysis
(12/20/03)
Over the past four weeks the Dow and S&P 500 have been
outperforming the Nasdaq as the technology sector has been under some selling
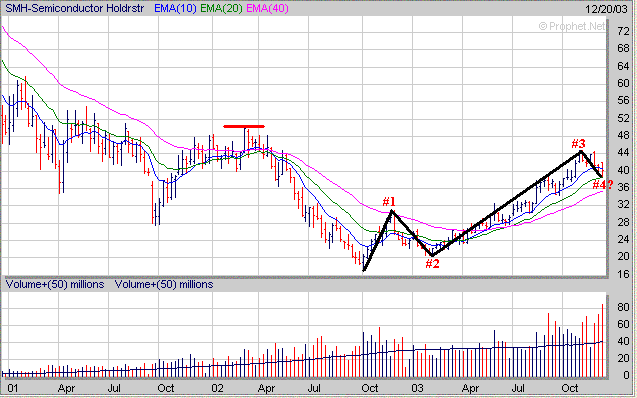
pressure. A look at the Semiconductors Holders (SMH) shows that this
sector has been under selling pressure 5 out of the last 6 weeks accompanied by
strong volume, however, so far the SMH's have been able to hold support at their
20 Weekly EMA near 38.50. Meanwhile it also appears the SMH's could be
undergoing a corrective 4th Wave for those that follow Elliot Wave
Theory.
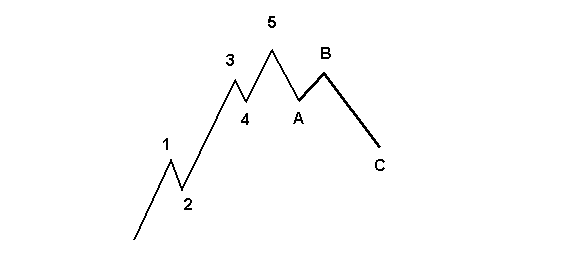
Once again without getting too technical a brief example of a what an Elliot
5 Wave Pattern looks like is shown below. Notice how Waves 1, 3 and 5
are upward moves with Wave 3 lasting the longest while Wave 5 is the shortest.
Meanwhile also notice that Waves 2 and 4 are corrective Waves which only last
for a brief period of time before the upward trend continues. If the
SMH's are currently going through a corrective 4th Wave then based on Elliot
Wave Theory there could be one more upward move (5th Wave) before a more
substantial correction occurs.
If a 5th Wave does eventually develop in the SMH's and they can
break above their previous resistance in the 44 area (point A) then in the
longer term it's possible they could rally up to the 50-51 range (point B) which
is the longer term 38.2% Retracement Level from the early 2000 high to the 2002
low. In addition the 50-51 area also corresponds to the high made in 2002
as well.
Meanwhile if the SMH's fail to hold support at their 20 Weekly
EMA near 38.50 then look for a quick drop back to their 40 Weekly EMA (purple
line) just below the 36 level.
As mentioned in the beginning both the Dow and S&P 500 have
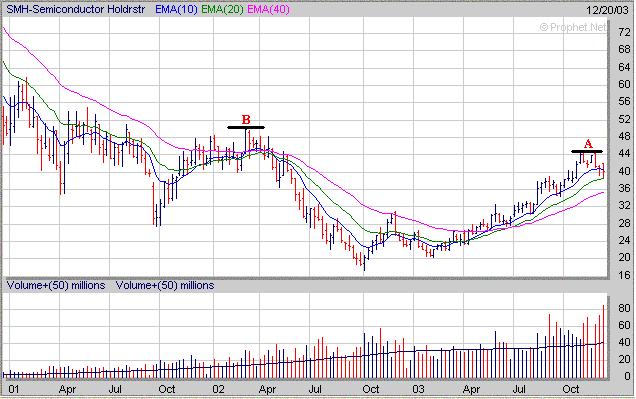
been outperforming the Nasdaq over the past month. The Nasdaq has been
basically stuck in a trading range since October between 1880 and 2000.
Eventually the Nasdaq will break out of this trading range and make a
substantial move in one direction or the other. Of course the big question
is which direction will it go? At this point there are two possible
scenario's. If the Nasdaq can break above solidly above the 2000 level
this could lead to a quick move up to the 2050-2100 range (point C). The
2050 area corresponds to the longer term 23.6% Retracement Level calculated from
the early 2000 high to the 2002 low while the 2100 level was near the high made
in January of 2002. Meanwhile if the Nasdaq breaks below the
bottom of its recent trading range around 1880 which is also near its 20 Weekly
EMA then it could quickly drop back to its 40 Weekly EMA (purple line) near
1760. The Semiconductor sector will likely have a big impact on
which direction the Nasdaq will trend in the weeks ahead so as talked about
above watch the SMH's closely. 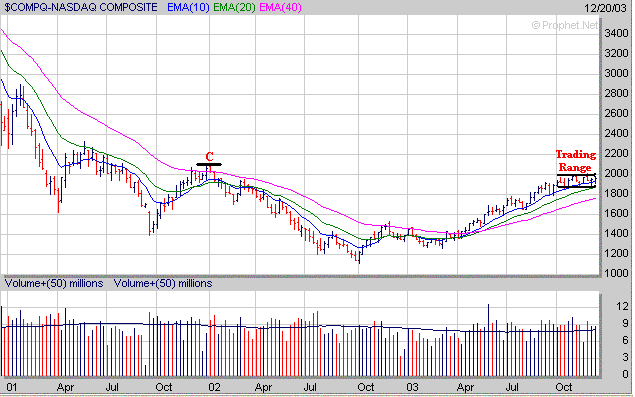
As for the other two averages the
Dow has been trending higher over the past 4 week and now has risen solidly
above its longer term 61.8% Retracement (calculated from the 2000 high to the
2002 low) near 10000. The Dow could run into some minor resistance near
10400 however there is a much more significant area of upside resistance near
10700 which is the longer term 76.4% Retracement Level and also coincides with
the high made in 2002 (point D). Meanwhile
it appears the Dow is still exhibiting a Wave 3 pattern and it will be
interesting to see if it can rally up to the 10700 area in the longer term
before a corrective 4th Wave occurs. 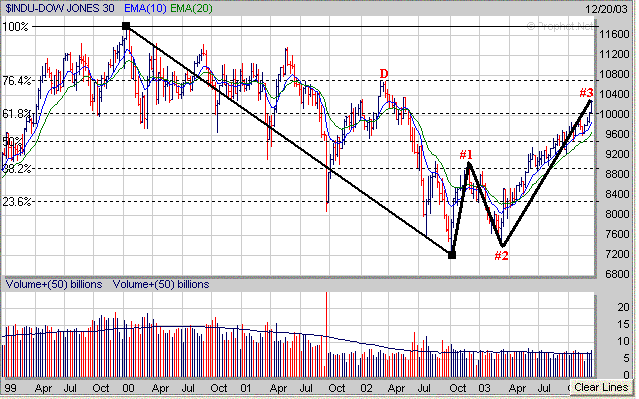
The S&P 500 has risen solidly
above its longer term 38.2% Retracement Level near 1065 and could run into some
minor resistance as it approaches the 1110 area. However there is a
more substantial area of upside resistance in the 1155 to 1170 range (point
E). The 1155 area is the longer term 50% Retracement Level while the 1170
area was near the high made in 2002. Meanwhile just like the Dow
it appears the S&P 500 is also exhibiting a Wave 3 pattern and the question
is will it undergo a corrective 4th Wave before it reaches the 1155-1170 area or
after? 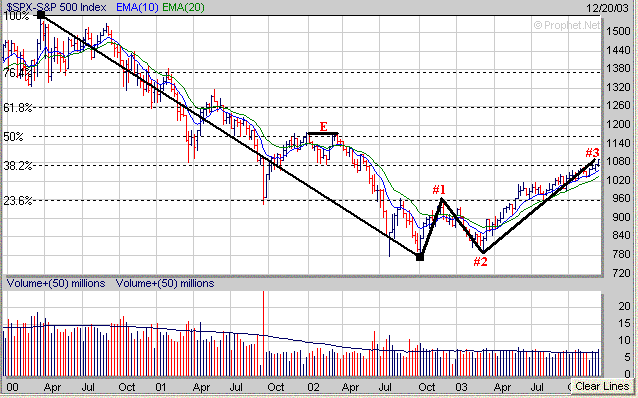
Finally when looking for stocks to
invest in focus on those that have strong Sales and Earnings Growth. ASVI
is an example of a company which has done well this past year. Notice how
over the past 3 quarters it has shown a strong increase in Sales and Earnings
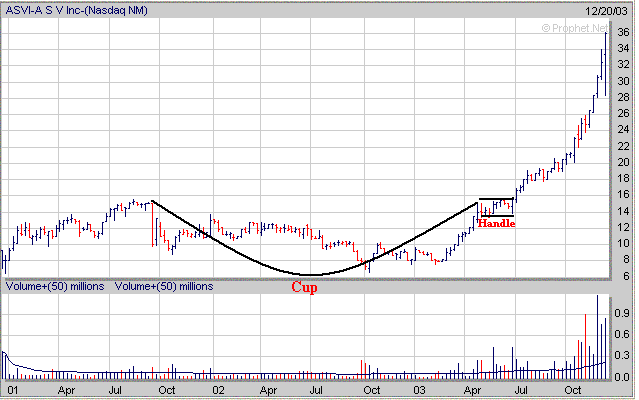
Growth. Also notice ASVI broke out of a "Cup and
Handle" pattern in early July and has been on a steady up trend since then
as it continued to have strong Sales and Earnings Growth. 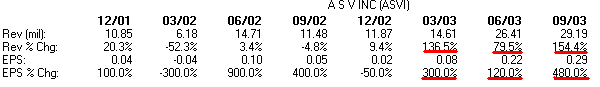
How can a Premium Membership to amateur-investor.net
benefit you as an investor? I use principles derived from "CANSLIM"
to search for stocks to put in my Top 100 List which are then ranked on
several factors including EPS Rank, RS Rank, Group Strength,
Accumulation/Distribution, Net Profit Margins and etc. From my Top 100
List I then narrow the list down further by featuring those stocks which
have developed a favorable chart pattern such as a "Cup and Handle",
"Double Bottom" or "Flat Base". These stocks are then
included in my "Stocks to Watch List" which gives investors a
quick reference to those stocks which may provide the best buying opportunities
over in the weeks ahead. Each stock in my "Stocks to Watch List"
includes specific Buy Prices, Stop Loss Prices (very important) and projected
Target Prices.
Signup
Today for a "Free" Trial Membership and see our complete list of
Stocks
which are currently developing a favorable Chart Pattern such as the
"Cup and Handle" or "Double Bottom"
Amateur-Investor.net
|

